
Frequentist vs Bayesian AB Testing: Which Method Is Right for You?
![]() ACADEMY / A/B testing training blog
ACADEMY / A/B testing training blog
In the A/B testing world, there are two ways to analyze your results after your experiment:
- The frequentist statistical method analyzes your results based on the observation of data from your current experiment.
- The Bayesian statistical method analyzes your results by combining prior data and data from your current experiment.
Understanding both methods can help you analyze your results outside of the A/B testing tool you use. It can also help you evaluate any A/B testing tool you may be considering for purchase.
In this article, you will learn:
- The pros and cons of using the frequentist statistics of analyzing your experiment’s results
- The pros and cons of using Bayesian statistics when you analyze results from your experiments
- The differences and similarities between both inferential methods
- Whether the statistical method matters when choosing an A/B testing tool.
Let’s dive in.
1What are frequentist statistics?
Frequentist statistics, or frequentist inference, views the probability of an event as the limit of the frequency of this event after many trials. It is a statistical approach where conclusions are based solely on the data from tests run in strictly similar conditions for each variation (hence its reputation as a data-driven method).
With the frequentist method, you start with a hypothesis that variation A is not different from variation B. When your experiment ends, you end up with a probability value (p-value).
The p-value is the probability of getting results as extreme as the observed results assuming there is no difference between variations A and B.
In experiments, the p-value is often taken to mean that there is no difference between your variations. This is one of the main critiques of the p-value. It can be misinterpreted as the probability of the hypothesis (that variation A is not different from variation B) given the data.
Frequentism only gives you the probability of the data when your hypothesis is true.
While there are limitations to using the frequentist method, it has become widely adopted in A/B testing because it is considered generally easier to implement.
Frequentist statistics benefits
One benefit to Frequentist statistics is that it is used widely throughout different research practices and industries, such as medical research.
Lucia van den Brink, CRO Strategist at Speero and Consultant at Increase Conversion Rate, says this makes it easier to understand.

If you’re new to experimentation, it is certainly worth learning how to understand and analyze results using Frequentist statistics because of how common it is in different industries and practices.
Another benefit of the frequentist method in A/B testing is how easy it is to estimate the duration of your tests. Since you know the sample size required to get results, you can estimate how long your experiment will take.
Frequentist statistics limitations
While the Frequentist statistics is more popular and easy to understand, it has several limitations.
In this article, you will learn:
- Requires a large sample size: to get statistically significant results, you will need a large sample size. If you want to test on a low traffic page, it is virtually impossible using the frequentist method.
- Cannot peek at experiments: “peeking” is a term in A/B testing that refers to looking at your results before the experiment is over. A limitation of Frequentist statistics is that you can never peek at your experiment - you can only confirm the reliability of the results only at the end of the A/B test. If you peek at your experiment, you invalidate its results. Some methods, like sequential testing, are trying to overcome this limitation.
- Risk of a false positive is present: with frequentist analysis, there is a risk of implementing a feature or accepting a test as winner that is a false positive result.
2What are Bayesian statistics?
Named after English statistician Thomas Bayes, Bayesian statistics allows you to include previously known data into your current experiment.
In the Bayesian method, you have a variety of data to work with including:
- Previously known data (called a prior).
- Current data from your experiment.
- The posterior which is the result of your Bayesian analysis. The posterior is your prior and your current data.
Because of this, the Bayesian method has lent itself to complex and agile A/B tests involving multiple (more than 6) variations.
Use case for Bayesian statistics: Bayesian statistics is used in several fields, such as spam detection.
With a prior knowledge of spam, we can determine the probability associated with the number of times a type of word appears in a spam email.
This probability, obtained through past experiments, enables us to consider a particular word as typical of spam. So, the method’s principal advantage is that it can free us from a fixed point and get results as quickly as possible.
Bayesian statistics benefits
Bayesian statistics offers two unique benefits - increased immunity to peeking and low false positive detection rates.
Peeking at experiments
Bayesian statistics, by design, is more immune to peeking than the frequentist method. Peeking at the data from your A/B tests allows you to stop an experiment early, which can save you time as you do not need to serve visitors the losing variation until the time the experiment ends.
As a result, you can test faster with the Bayesian approach as you don’t need to wait until the end of the test.
Andra Baragan, Founder at Ontrack Digital, agrees:

However, it is important to keep in mind that Bayesian statistics is not completely immune to peeking. David Robinson, Director of Data Scientist at Heap, summarizes it well in this article.
In it he explains that the Bayesian method is not completely immune to peeking, and that looking at results early may increase the probability of obtaining inaccurate results. David says, “In that sense, Bayesian methods are appealing: they set a goal and hold to it no matter how much you peek. Indeed, perhaps the goal they set is better: Bayesian statisticians often argue that the frequentist focus on the Type I error rate is misguided. Certainly the expected loss has a relevant business interpretation (“don’t risk decreasing our clickthrough rate”). But maybe we should care about the error rate.”
He says, “stopping a Bayesian test early makes it more likely you’ll accept a null or negative result, just like in frequentist testing.” Remember this when you consider peeking at your next A/B test.
Low false positive detection rates
Because of the way the Bayesian analysis works, it is harder for you to get a false positive in your experiment results. Because Bayesian statistics have gain intervals, you’re less likely to reject a true hypothesis. This is because the gains from a false positive will be too small to make implementing it worth your while.
Another benefit is being able to quantify the conversion gain.
Because you can quantify the range of your conversion gain, you can compare it to the associated costs of serving the winning variation to all your visitors. This helps you make quick business decisions about implementing results from your experiments.
Bayesian statistics limitations
The Bayesian approach starts from a premise that is completely objective in the case of tossing a coin, but becomes subjective when it comes to a user experiment.
For A/B tests for example, it is not recommended to take into action the results of previous experiments that were produced over a different timescale and in potentially completely dissimilar conditions.
After all, the first principle of A/B testing is to compare two variations in exactly the same conditions, concurrently and not sequentially.
Bayesian statistics has two main limitations.
Invalid results
The first limitation stems from its use of prior knowledge.
In a whitepaper on the Issues with Current Bayesian Approaches to A/B Testing in Conversion Rate Optimization, Georgi Georgiev said:

Because Bayesian statistics uses historical data, you can get invalid results if you use prior data that is flawed. Your historical data from previous experiments may be affected by seasonality, trends or in extreme cases, a global pandemic which changed consumer behavior.
For example, a florist website will get invalid results if it uses historical data from its Valentine’s Day experiments for its Christmas A/B tests.
This is because a basic principle in A/B tests is you compare two variations in the same conditions at the same time. When you use flawed historical data in your Bayesian analysis, you risk detecting a false positive.
Inaccurate results
Another disadvantage of the Bayesian approach is how difficult it is to grasp for non-statisticians.
Bayesian statistics try to calculate a probability distribution, which is a much more complex concept than a simple confidence index. In the case of A/B testing, this probability distribution is based on conversion gains or losses.
Lucia van den Brink, concurs:
When you try to simplify this distribution using the [-0.5%, +2%] interval, you run the risk of reading the results wrong. This is because there is a substantial distance between -0.5% and +2%. The cutoff on the interval is arbitrary as you start from a point where you judge statistical significance to be negligible.
3Bayesian vs Frequentist Statistics: The Key Differences
There are three key differences between Bayesian and Frequentist Statistics: prior probability distribution, sample size, and peeking.
Prior probability distribution
A key difference between Frequentist and Bayesian statistics lies in prior probability distribution.
Let’s illustrate with an example:
Take a page where you get 18,000 monthly visitors. You want to increase conversions and you design a challenger page, B. When you run your experiment with the original page as control, the way you approach your experiment and results will vary.
In the frequentist method, you will pose a null hypothesis:
Conversion rate on Page A equals conversion rate on page B
You run your experiment and get your results. Your results may be:
- Page B has a higher conversion rate than page A - You have enough evidence to reject the null hypothesis.
- Page B doesn’t have a higher conversion rate than page A - You do not have enough evidence to reject the null hypothesis.
In the Bayesian method however, you factor in prior data like historical experiment results involving Page A, previous conversion rates for Page A and other data you may have.
Sample Size
Another key difference lies in sample size. With frequentist inference, you need a large sample size to obtain statistically significant results.
Bayesian inference, on the other hand, gives you more leeway with sample size for your experiment.
Andra says:
Peeking at experiment data
A further difference lies in peeking at your experiment data. Bayesian statistics is somewhat immune to peeking, though not completely as outlined above.
The opposite is true in the frequentist approach. When you peek at your data mid experiment, you negate your results. Sequential testing looks to alleviate this.
Let’s use a simple example to try to better understand the difference between these two approaches.
LET’S TOSS A COIN TEN TIMES
- If we use frequentist modeling, then there is a “real” probability of getting tails. If, for example, we get tails on six out of ten tosses, then, based on the results of this experiment, the probability of getting tails is equal to 6/10 = 0.6 (or 60%).
- According to the Bayesian approach, we’re not interested in this probability but rather in its a priori law. Essentially, if the coin is balanced, then in theory the probability of previous experiments.
When it comes to coin tossing, clearly the probability calculated by the frequentist method will settle at around 0.5 if the coin is tossed a large number of times.
4Bayesian vs frequentist statistics in A/B testing
Frequentist statistics has seen a massive adoption in A/B testing since 2015. But Bayesian has a place in experimentation as well.
1. Frequentist offers greater accuracy with less complexity
Frequentist statistics in A/B testing is valued because it is more accessible to everyone.
Once the risk of getting a false positive has been mitigated, you can get accurate results with the frequentist method with less complexity than in the Bayesian method.
2. Bayesian allows for dynamic traffic allocation
Since Bayesian statistics allows you to peek during experiments, you can stop experiments early.
This is important especially if you have a losing variation that could be harming your conversion rates. You can divert visitors to a better performing variation.
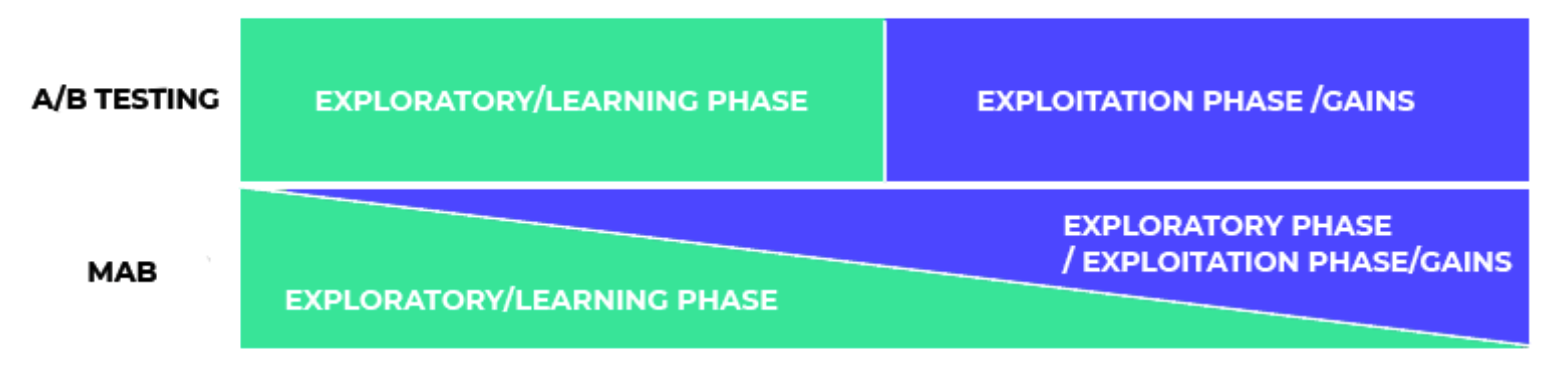
This idea lies at the heart of dynamic traffic allocation. Dynamic traffic allocation in multi-armed bandit tests allow you to earn and learn at the same time. You overcome the problem of exploring first, then converting later.
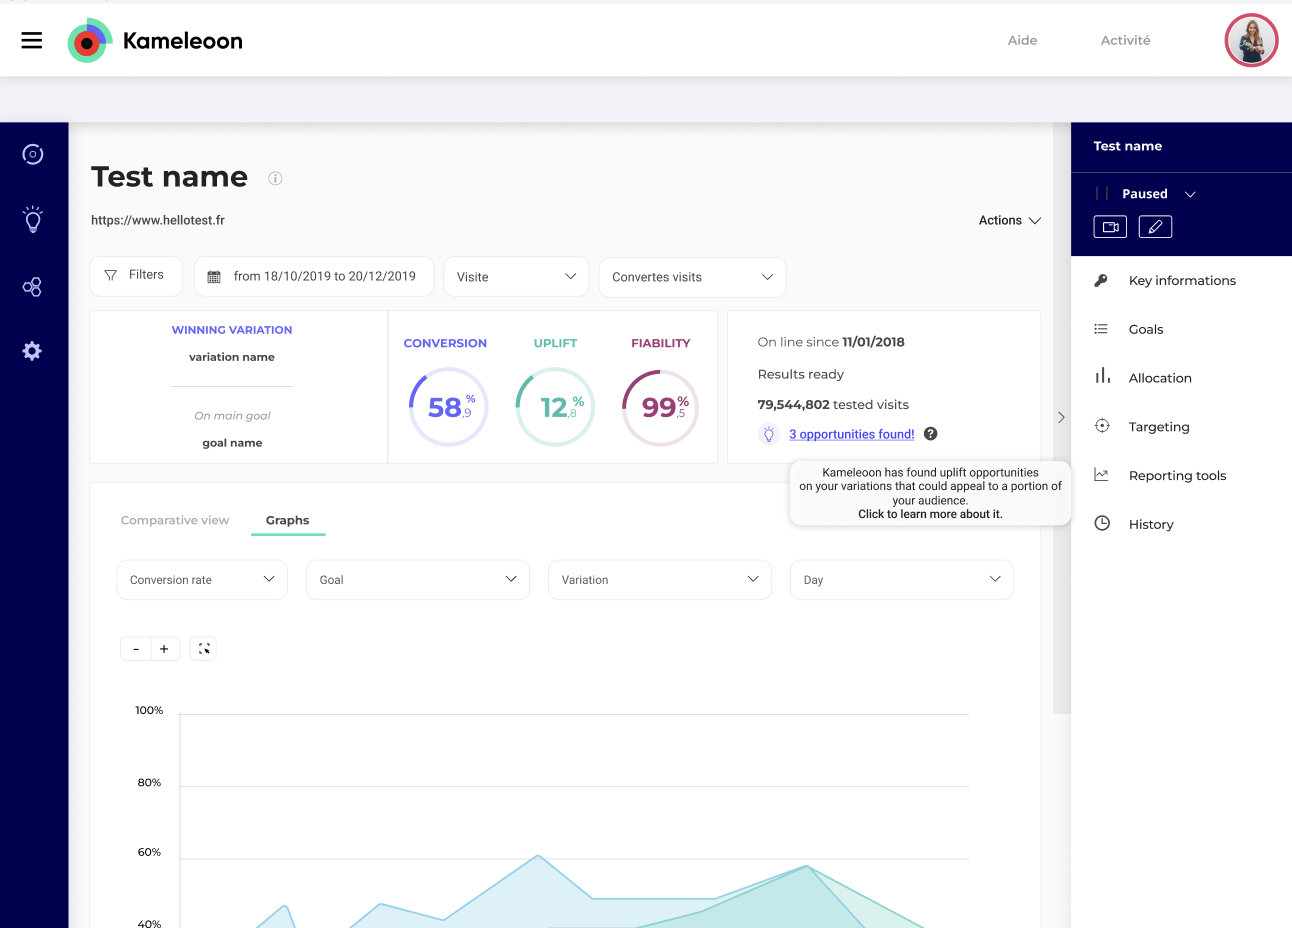
In Kameleoon, you can turn on dynamic traffic allocation when you set up your A/B tests. Simply toggle the button from OFF to ON during the ‘Traffic distribution’ stage of finalizing your experiment.

Kameleoon will automatically direct traffic to more successful variations during your A/B tests. This helps you save the cost incurred from losing visitor conversions.
5Frequentist or Bayesian approach to A/B testing: Which should you choose?
One of the most rigorous analyses comparing the frequentist and Bayesian approaches was carried out by the statistician Valen Johnson and summarized in his article published in the Proceedings of the National Academy of Sciences in 2013 (1).
The aim of his frequentist analysis was to explore the data collected so as to identify a significant effect that could only be explained by the hypothesis of the experiment.
His Bayesian analysis compared two hypotheses and assessed the chances that one was true in comparison with the other, by using the data available at the time of the experiment and the information already known about the subject.
His conclusion was that, in the case of a Bayesian approach, the threshold of statistical significance, commonly accepted as being 95%, is insufficient for concluding that the test is significant or not.
In other words, this only further confirms that the choice of the frequentist approach by A/B testing tool providers is valid.
The truth, however, is you don’t have to pick between the two.
Both inferential methods have their use cases and scenarios when it’s best to apply them.
The Bayesian approach is sensible if you’re running experiments:
- On a page with low traffic
- With a short testing window such as an experiment during a sales promotion
- Where you are testing multiple variations
The frequentist method works for experiments where you:
- Test on a page with heavy traffic
- Need a high degree of accuracy with lower complexity.
At Kameleoon, we offer the Controlled-experiment Using Pre-Experiment Data (CUPED) technique as well as both Bayesian and Frequentist methods.
To learn more about statistical significance and how Kameleoon’s statistical engine works, you can check out our documentation.
![]() ACADEMY / Return to our A/B testing training course
ACADEMY / Return to our A/B testing training course