A complete guide to heatmaps in digital experimentation

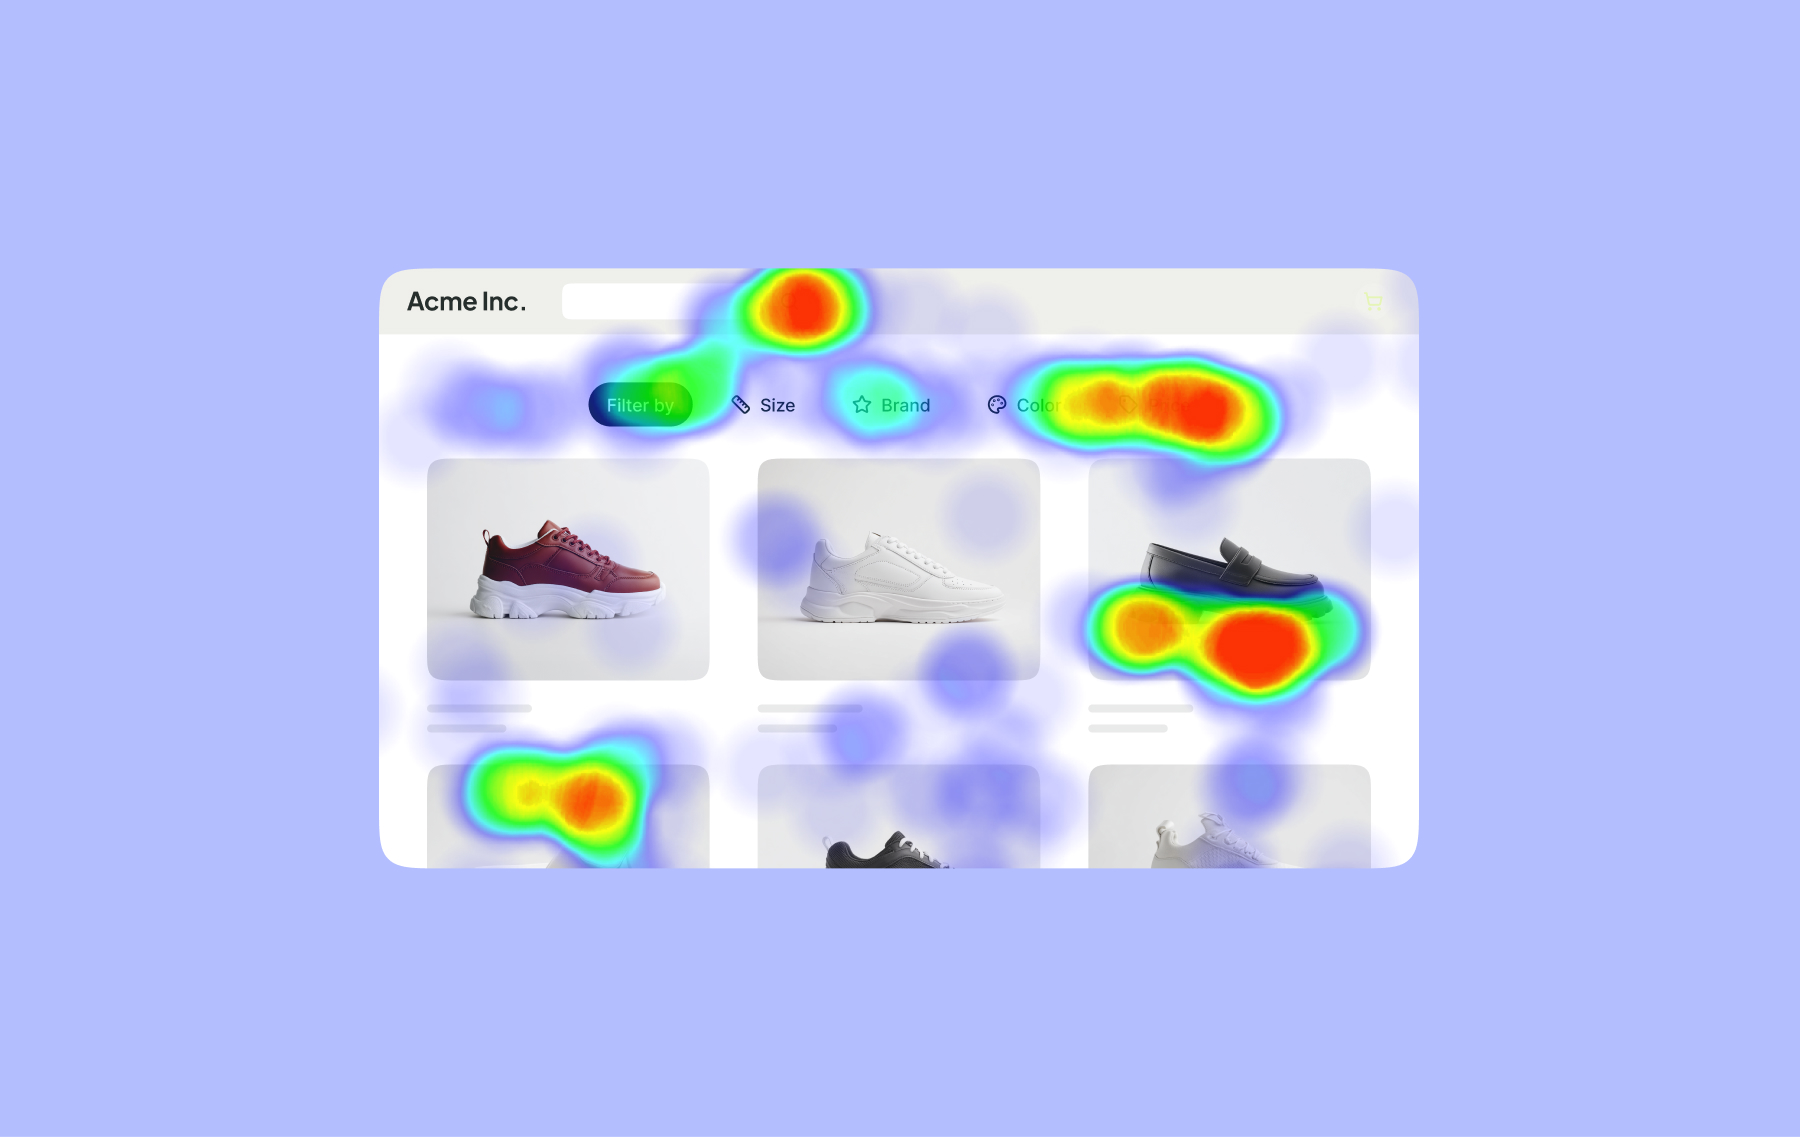
A heatmap is a color-coded visualization of how people behave on a webpage. It takes behavioral data (such as clicks, scrolls, and cursor movements) and overlays it directly onto the page, turning thousands of individual interactions into a visual pattern that’s easy to read at a glance. Warmer areas show where activity is concentrated, while cooler areas show where it’s sparse.
For digital marketers and experimentation teams, heatmaps provide a quick visual read on how people are interacting with an experience, and where that behavior differs from what was expected.
A heatmap example and types
Here's an example of a click heatmap overlaid on an eCommerce page:
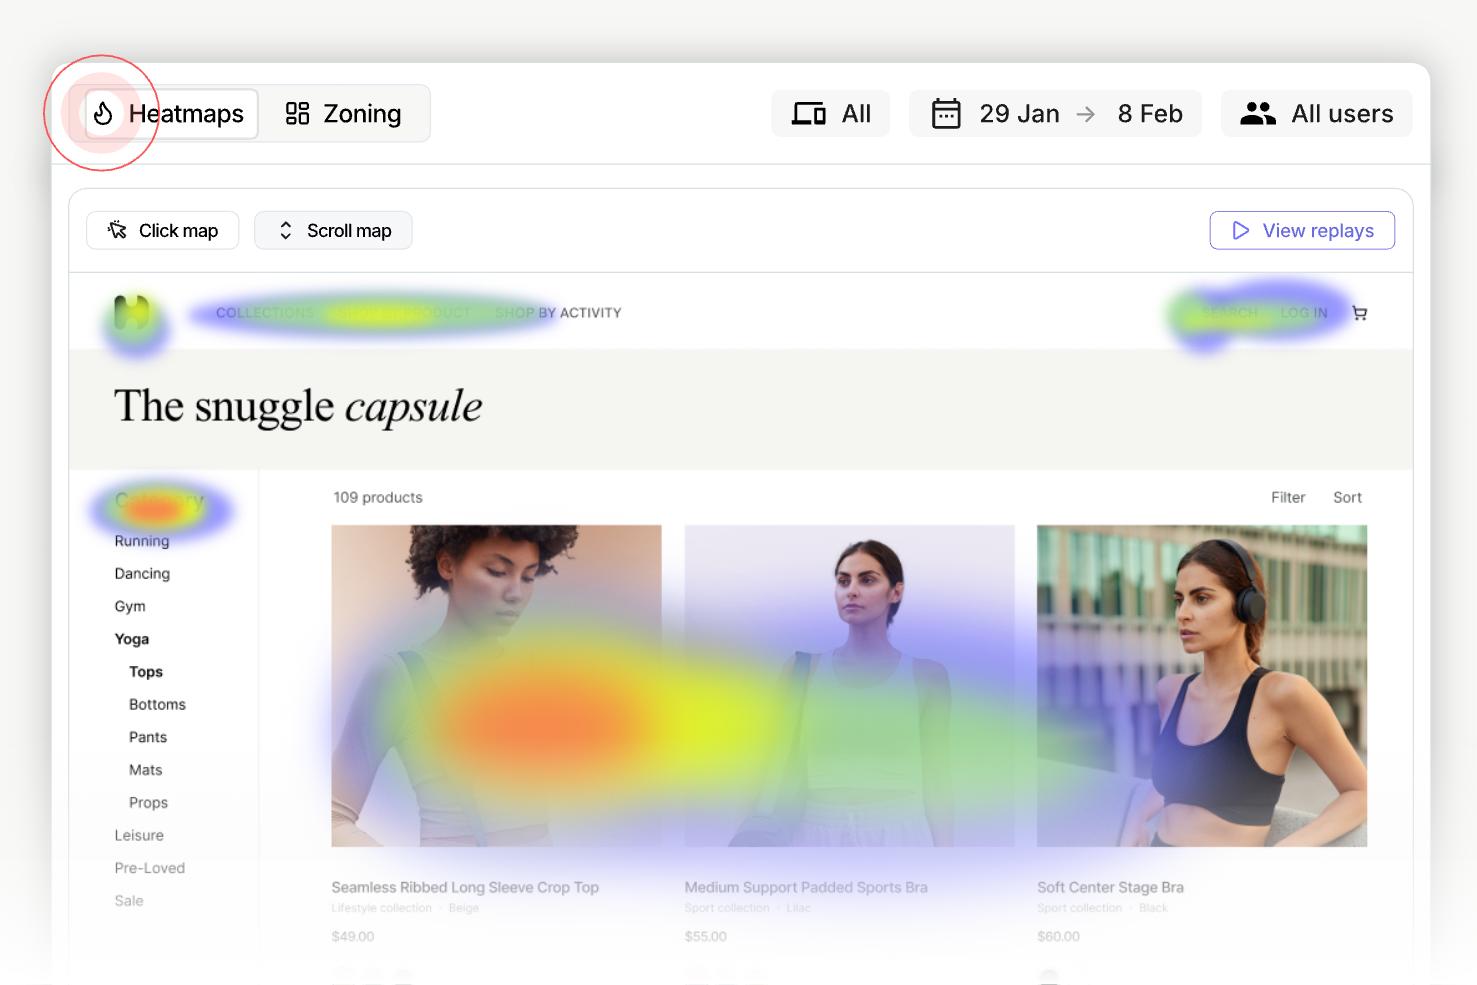
The click "hotspots" are instantly visible: click clusters form around the navigation, search area, category controls, and parts of the product grid.
Different heatmaps answer different questions about user behavior:
- Click or tap maps: Where are users clicking?
- Scroll maps: How far are users getting?
- Movement or attention maps: Where is activity or attention concentrating?
Each type highlights a different aspect of user behavior and can point teams toward areas worth investigating.
Uses of heatmaps in digital marketing
In marketing, heatmaps are primarily used as a research tool: to understand how people experience landing pages, product pages, forms, pricing pages, and other conversion paths.
Digital marketers can use heatmaps to examine the digital experience at three levels:
- At the website level, heatmaps help marketers understand how visitors interact with the site as a whole, including navigation and other ways of finding content and products.
- At the page level, they help marketers understand how visitors interact with important marketing pages, such as homepages, landing pages, product pages, and pricing pages.
- At the element level, they allow marketers to look more closely at individual components on those pages, such as CTAs, images, videos, pricing tables, offers, and forms.
1. Understanding how visitors use websites
At the broadest level, heatmaps help digital marketing teams see how the traffic they're generating actually behaves once it lands on the site, including whether visitors are reaching the products, content, and offers that matter most, and how they engage with structural elements like the primary navigation, site search, and footer along the way.
Here’s a click heatmap (via Microsoft Clarity) showing visitor activity across a website's navigation and header area. Red and orange hotspots show a strong concentration of clicks on a small number of navigation items and CTA buttons (several of which rank among the top 10 clicked elements sitewide), indicating these links are carrying a significant share of visitor activity. By contrast, several nearby navigation links show minimal or no click activity, suggesting visitors are largely bypassing them in favor of a handful of high-traffic paths:
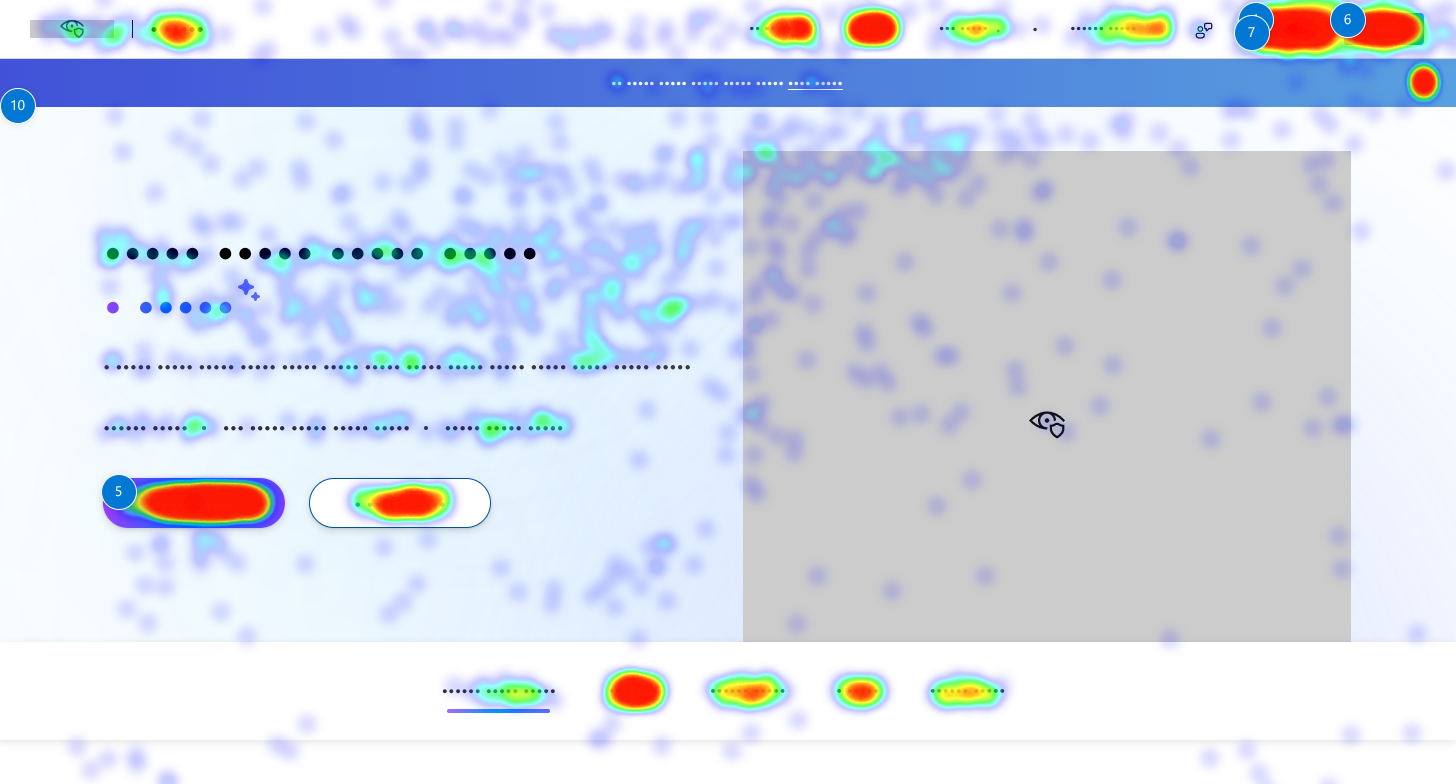
This kind of data helps digital marketers see how usability affects conversion and whether visitors are finding what they need along the way, or running into friction that causes them to drop off.
Here’s what marketers can learn from interactions with some of the key elements visitors use to find their way around a site:
2. Understanding how visitors use key website pages
Beyond sitewide navigation, heatmaps let digital marketing teams zoom into the specific pages that matter most for campaigns, conversions, and revenue. Page-level heatmap analysis can reveal whether visitors are interacting with the page in ways that support its marketing goal.
For example, the scrollmap below (from Contentsquare) uses a heat gradient to show how far down the page visitors typically scroll. Red indicates the highest visitor engagement, fading through orange, yellow, and green, down to blue where engagement drops off significantly.

On this page, the hero section, including the main headline and primary CTAs ("Get a Demo" and "Watch a Product Tour"), sits within the red-to-orange zone, confirming that nearly all visitors see this messaging before scrolling further. Engagement fades to yellow and green by the customer logo section, and drops into blue shortly after, meaning a smaller share of visitors are reaching content further down the page, such as the "Conventional web analytics don't give you the full picture" section.
For a digital marketing team, this kind of insight is directly actionable: it confirms the hero messaging and primary CTA are positioned where the page gets the most attention, while flagging that content further down (like supporting proof points or secondary messaging) may need to be moved higher, condensed, or reinforced elsewhere (such as in email or paid follow-up) if it's meant to influence conversion.
Here's what heatmaps can reveal on some of the pages digital marketing teams care about most, and the kinds of questions that data can help teams investigate.
3. Understanding how visitors interact with individual page elements
At the most granular level, heatmaps show how visitors interact with the specific elements marketing teams work on constantly: CTAs, headlines, images, and forms. These are often the same elements marketing teams are already optimizing for conversion.
Here’s a movement heatmap from Mouseflow, showing cursor activity across a homepage. The warmest areas (red and orange) cluster around the main headline and the CTA buttons, showing that visitor attention is concentrated on the primary messaging and both CTAs rather than one clearly outperforming the other. Activity cools through the trust bar beneath it, where the customer logos receive moderate engagement, suggesting visitors do register those elements as well.
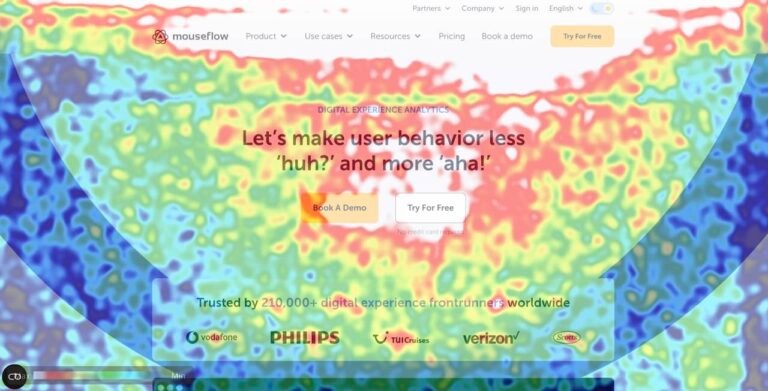
For a digital marketing team, this kind of pattern is useful for validating whether attention is landing where it's intended. Here, both CTAs are drawing meaningful engagement, which could support keeping both options rather than defaulting to a single primary CTA. It also confirms the headline is earning real attention, making it a strong candidate for message testing (since any test results would reflect visitors who are actually seeing and reading it, not just scrolling past).
At this level, heatmaps give marketers a much more detailed view of what's actually happening on a page. Together, these analyses help digital marketing teams spot where the experience they designed differs from how visitors actually interact with it.
Heatmaps show behavior, not causation
Heatmap analysis has its limits. Heatmaps show what users do, but not why they do it. Heatmaps also can’t tell if changing the experience would produce a better outcome.
Imagine a retail bank launching a new marketing campaign with a personalized home loan landing page, combining a personalized offer with an EMI calculator, eligibility information, supporting content, and an application journey.
Suppose the heatmap shows that visitors are largely skipping the personalized offer at the top of the page and instead interacting more heavily with the EMI calculator further down.
That heatmap observation is interesting because it diverges from the team's assumption that the personalized offer would be the natural starting point for the experience. While the heatmap can show that this behavior is happening; it can't tell the team why. Visitors may not immediately understand what makes the offer relevant to them. They may want to establish affordability before considering a specific offer. Or they may already know what they're looking for and be using the calculator to validate a decision they've partly made.
The next question is whether this behavior actually matters to the outcome the team cares about. The team could look at whether interaction with the personalized offer is associated with visitors going on to start or complete an application, and whether that pattern holds across customer segments or acquisition sources.
If the data shows that bypassing the personalized offer is associated with weaker outcomes, the team has identified a potentially meaningful relationship. But that relationship alone doesn't tell them what to change or whether changing it would actually improve the outcome.
This is where experimentation and A/B testing comes in. Instead of assuming the heatmap has already answered the question, the team can test a different experience and determine whether the change itself causes a better outcome.
The heatmap surfaced a pattern worth investigating. Only testing can establish whether acting on it actually works.
Turning heatmap observations into testable hypotheses
When it comes to heatmap analysis for A/B testing or experimentation, CRO teams are trained to look for anomalies.
- Dead zones
- Rage clicks
- Abandoned sections
- Ignored CTAs
- Unexpected interactions
These patterns can be useful signals. But they shouldn't automatically become hypotheses, or, worse, directives for change.
In mature experimentation programs, heatmap analysis is one part of the research phase. Funnel and conversion data, session recordings, customer feedback, previous experiments, and business context can all contribute to understanding the same behavior.
The process is therefore not simply Heatmap → problem → hypothesis → test.
Instead, the heatmap becomes one source of data in a broader research process. Teams start with an observation, interpret it alongside other data and qualitative research, develop a hypothesis, and then test the change.
What heatmap can and cannot do in an experimentation program
As we’ve seen, heatmaps earn their place in the research phase, but they are not a substitute for the actual experiment, because they can show you where visitor attention is focused and what they interact with, but cannot explain why with any level of statistical significance.
Most importantly, they can’t tell you whether changing the page would make the observation better or worse for your program. After all, a heat map has no control group, no variation to bounce off of, and no absolute data (because clusters are highlighted in such a way as to compare them to other clusters).
For a team early in its experimentation journey, it can be tempting to act directly on heatmap findings alone. In the short-term, this can be useful, but as programs mature and mistakes become more expensive, there is great value in letting your heatmap dictate the research question rather than treating it as an answer.
Heatmaps in the marketing and experimentation stack
Heatmaps have a useful place within a marketing and experimentation stack. They're particularly useful during research, helping teams understand existing behavior and spot patterns worth investigating further.
Also, they’re just one source of data among many. They make behavioral patterns easier to see, while analytics, qualitative research, and experimentation help teams understand and act on those patterns.
That’s why heatmaps work best alongside other research tools in an experimentation stack. Mature experimentation platforms often integrate with a host of behavioral analytics and heatmapping tools so teams can connect research insights with experiment data. Kameleoon, for example, integrates with ContentSquare (Hotjar), Microsoft Clarity, Mouseflow, and Mixpanel, among others, so you can run winning, data-backed experiments.