What Is Sample Ratio Mismatch (SRM)?


Sample Ratio Mismatch (SRM) is one of the most common and most dangerous issues in experimentation.
It occurs when one variation in an A/B test unintentionally receives more traffic than planned, undermining the validity of the experiment and putting results at risk.
At first glance, SRM can look like a minor technical hiccup.
In reality, it can completely invalidate a test, even when results appear statistically significant.
This guide is here to help you more fully understand what SRM is, why it matters, how it corrupts experiment data, and how you can detect and prevent it to achieve data accuracy.
Sample Ratio Mismatch (SRM) defined
Sample Ratio Mismatch (SRM) may sound complex, but the concept is straightforward when broken down into its three components:
- Sample
- Ratio
- Mismatch
Sample
In A/B testing, the term sample refers to how traffic is allocated across the variations in an experiment.
In other words, it describes who sees what, and in what proportion.
This allocation is intentional. It’s defined before the experiment starts and is a critical assumption behind the validity of the results.
Equally split samples
In a standard A/B test, traffic is usually split evenly.
That means:
- 50% of visitors see the original experience (the control)
- 50% of visitors see the variation
This equal allocation helps ensure that any differences in performance are caused by the change itself, not by differences in who was exposed to each version.
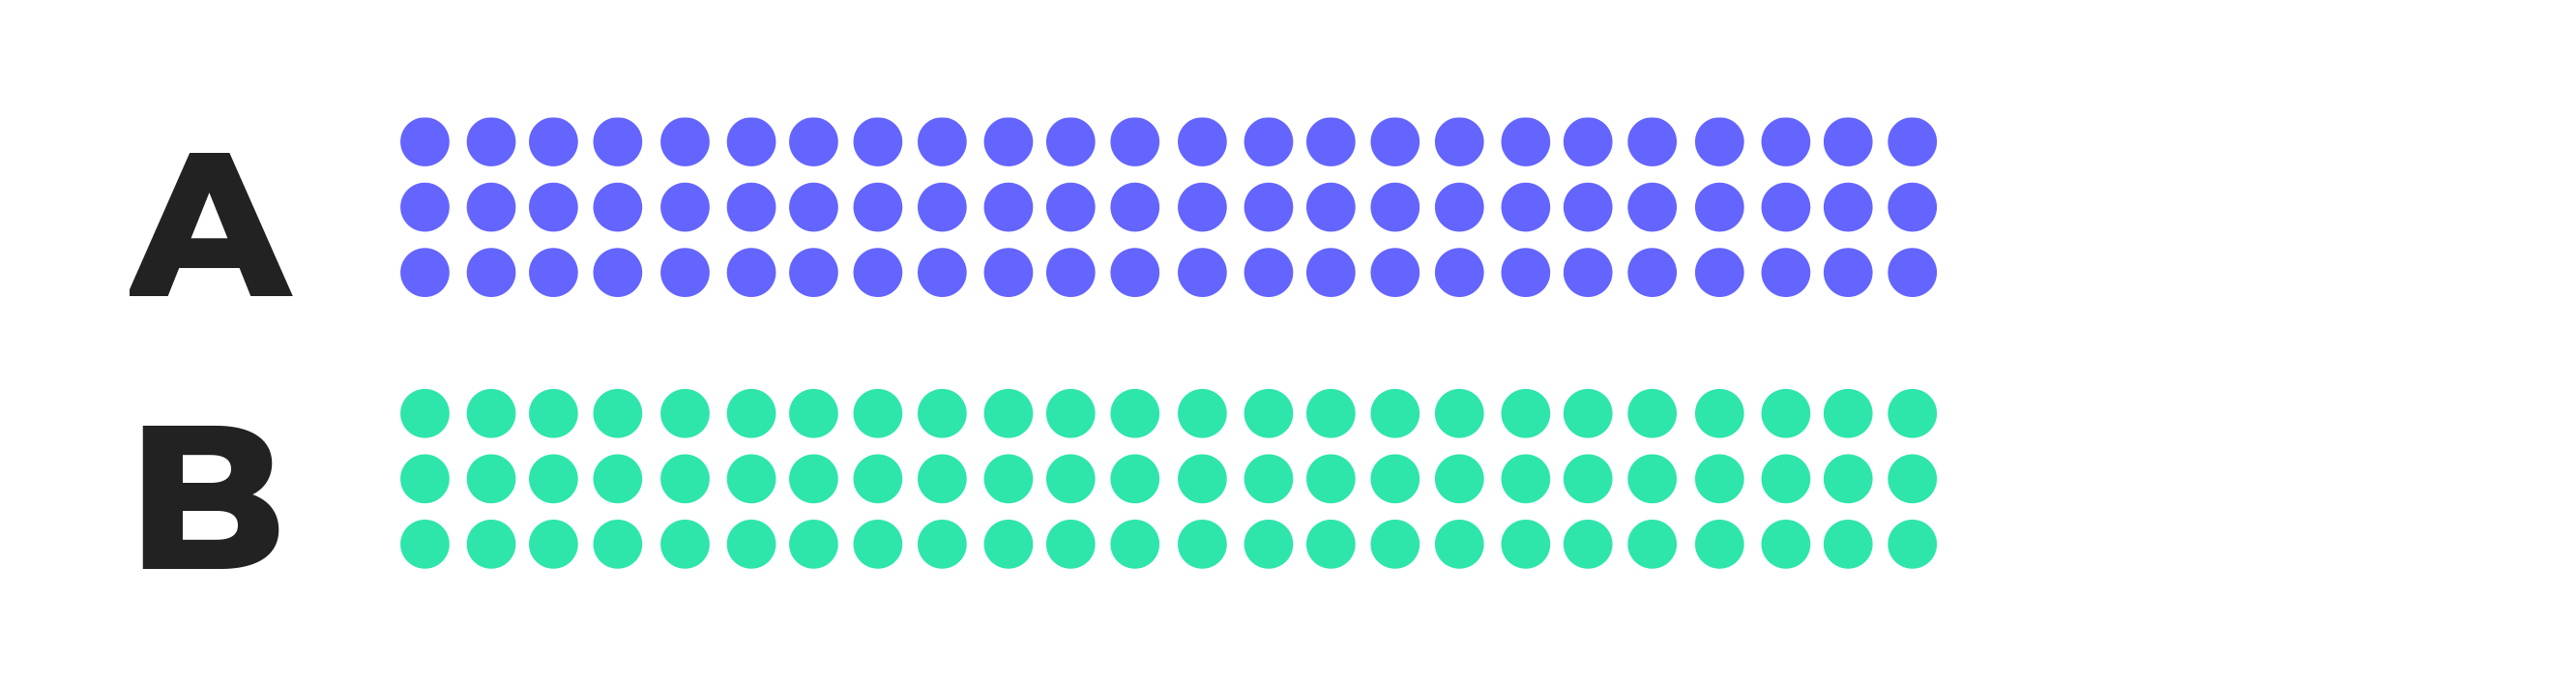
Visually, an equal split looks like a simple 50/50 distribution like this:
Equally split samples with multiple versions
Experiments don’t have to be limited to just two versions.
When testing multiple variations at once, traffic can still be split evenly across all versions. For example:
- 3 variations → 33% / 33% / 33%
- 4 variations → 25% / 25% / 25% / 25%
As long as the allocation is intentional and correctly implemented, equal splits across multiple variations preserve randomization and experimental integrity.
For example, a sample equally split three ways (33% / 33% / 33%) would look like this:

Unequally allocated samples
In some cases, traffic is intentionally allocated unevenly across variations.
For example:
- 80% of visitors see the control
- 20% of visitors see the variation
An unequally-allocated 80%/20% sample would look like this:

This approach is sometimes used to reduce risk, limit exposure, or test cautiously in production environments.
However, unequal allocation comes with trade-offs, including:
- Smaller samples for some variations
- Longer time to reach reliable results
- Greater sensitivity to implementation errors
Because of these factors, unequal allocation increases the risk of misleading data if not handled carefully.
A quick note about multi-armed bandit tests
The main exception is experiments that use dynamic traffic allocation, also known as a multi-armed bandit approach.
While this mid-test reallocation may resemble SRM, bandit algorithms include statistical safeguards designed to preserve decision reliability.
That said, because allocation is intentionally dynamic, SRM diagnostics cannot be applied in the same way as they are in fixed-allocation A/B tests.
Why intentional allocation matters
In all of these examples, traffic is intentionally allocated in a specific way. That intended allocation is a foundational assumption of valid experimentation.
SRM occurs when the observed allocation no longer matches the intended allocation.
When this situation happens, the experiment’s validity is compromised because the samples can no longer be reliably compared.
Ratio
The ratio refers to the proportion of traffic each variation receives during an experiment.
Regardless of whether traffic is split evenly or unevenly by design, the ratio must remain stable and consistent throughout the test.
If traffic is unintentionally routed so that one variation receives significantly more visitors than the others, the traffic ratio becomes distorted.
Mismatch
A mismatch occurs when there is a gap between:
- how you intended to divide your sample
- how users were actually allocated during the experiment
In A/B and multivariate testing, the traffic split defined at the start of the experiment must remain consistent from beginning to end.
When that consistency breaks, you have a Sample Ratio Mismatch (SRM).
What SRM looks like in practice
When SRM occurs, traffic becomes heavily weighted toward one variation.
Instead of the expected, stable distribution, the observed allocation drifts, often in ways that aren’t immediately obvious.
Visually, SRM appears as a lopsided distribution where one variant receives far more exposure than intended. The outcome ends up looking something like this:
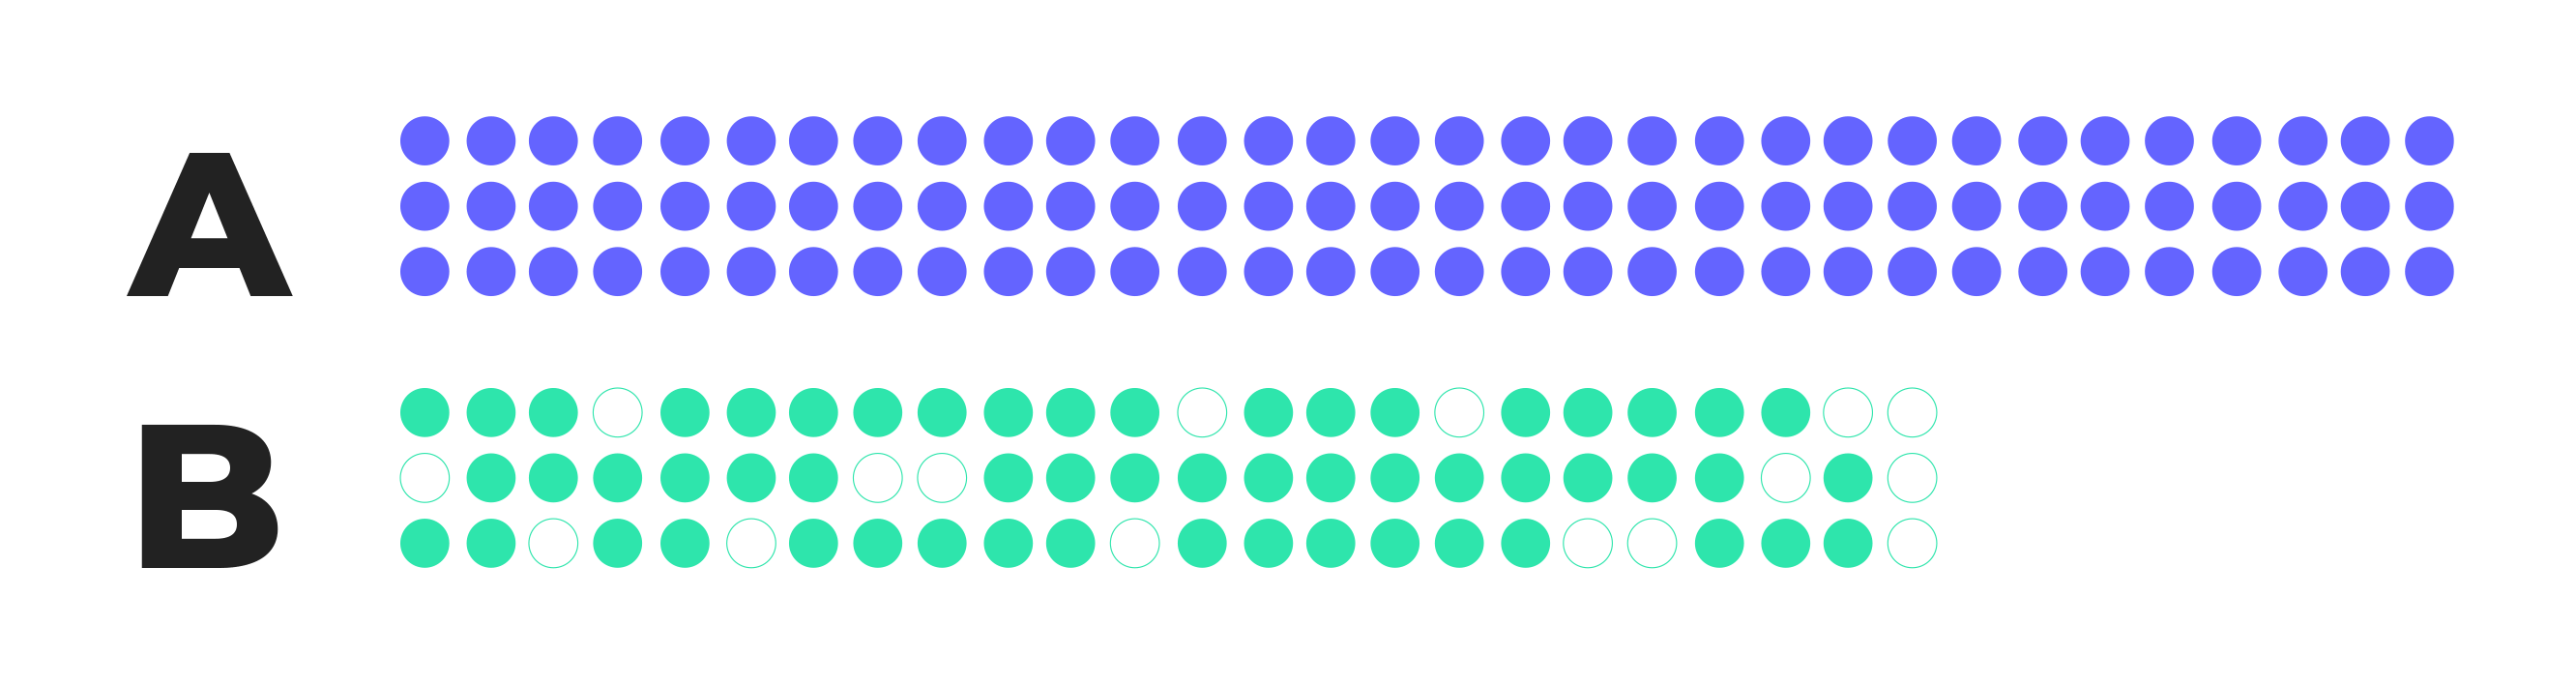
Here, version B has received disproportionately fewer users than version A, as shown by the shorter bar and missing data points.
When this outcome occurs, test results can’t be fully trusted because the uneven distribution of traffic skews conversion numbers.
Why Sample Ratio Mismatch is a serious problem
Experimentation relies on random assignment to ensure that differences in outcomes are caused by the variation itself, not by differences in who sees it.
SRM breaks that assumption.
When traffic is unevenly allocated in ways that were not intended, the experiment population is no longer randomized.
Certain user segments may be overrepresented in one variation, while others are underrepresented.
As a result, performance differences can no longer be attributed with confidence to the experience being tested.
Statistical significance may still appear, but the underlying data is biased.
Common causes of SRM
SRM can occur with samples of any size. However, the larger the sample, the more likely it is to be detected.
No matter the sample size, there are over 40 potential reasons why SRM occurs. Most of the time, the issues relate to improper set-up of the test, bugs with randomization, or tracking and reporting issues.
Common causes include:
- Targeting or audience definition errors that allow users to qualify for one variation more often than another
- Client-side execution issues, such as scripts failing to load consistently due to blockers, latency, or browser constraints
- Mid-test changes, including deployments, hotfixes, or configuration updates that affect allocation logic
- Device or platform differences, where users on certain devices are bucketed differently
- Redirect or URL-based experiments, where users drop out before allocation is completed
- Data collection mismatches, where analysis includes users who were never truly exposed to the experiment
Many SRM incidents happen after a test has already launched, which is why monitoring for SRM while the test is running is critical.
How to avoid SRM
The good news is that Kameleoon makes it very easy to check for and avoid SRM. Unlike many competing testing platforms, we pay attention to SRM for you, so you don’t have to!
How?
We’ve developed an in-app notification alert that displays on any test when SRM is suspected or detected.
The notification sits on the bottom, right corner your results screen and looks like this:
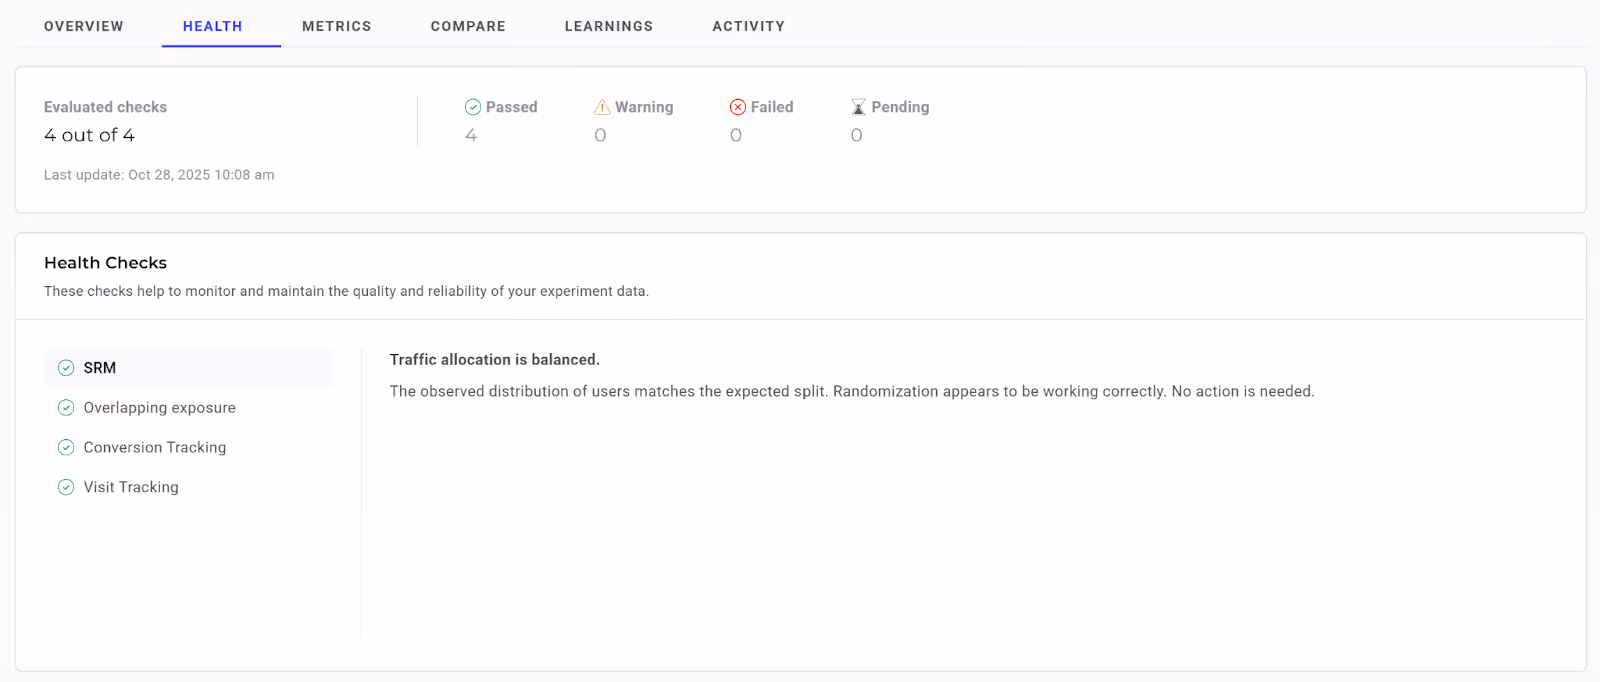
So, when running your experiments, all you have to do is be on the lookout for any SRM alerts.
Many testing platforms, including Kameleoon, now have real-time SRM checks that flag if a test is showing SRM and allow you to mitigate errors and risks.
How SRM quietly invalidates an A/B test
Imagine you’re part of a product team running an A/B test on a checkout page to evaluate a simplified form design. Your goal is to improve lead generation conversions.
You set-up the experiment follows:
- Variant A (control): the original checkout experience
- Variant B: simplified checkout experience
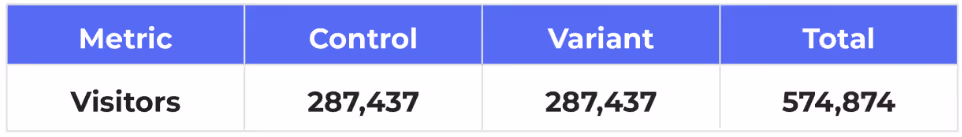
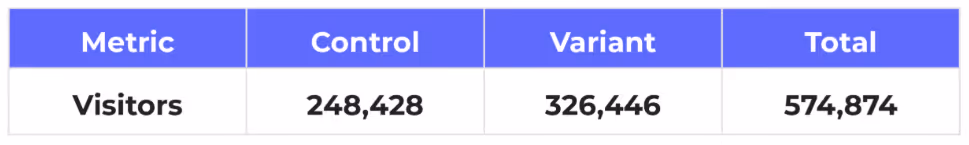
The test is planned to run for two weeks and is expected to include a large sample of 574,874 visitors.
Because it’s a standard A/B test, traffic is intentionally allocated 50/50. Based on that setup, the sample should be evenly split like this:
The initial results look promising
Now, imagine, after two weeks, the test concludes.
At first glance, Variant B appears to have outperformed Variant A with a statistically significant lift in conversion rate.
The result looks like a clear win.
The allocation problem
But during a deeper review, you notice something concerning: traffic was not equally split.
Instead:
- Variant A: received 43% of visitors (248,428 visitors)
- Variant B: received 57% of visitors (326,446 visitors)
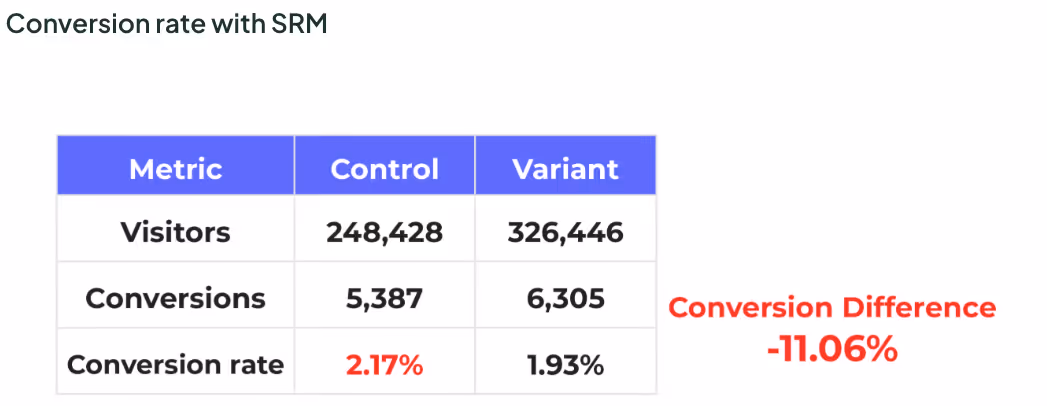
The traffic allocation is noticeably lopsided and far beyond what random fluctuation would explain. SRM has occurred:
Why the results can’t be trusted
The issue isn’t simply that SRM occurred.
The real problem is that your test results are totally skewed and can no longer be trusted.
Had the traffic been equally allocated, you might have seen results like this:
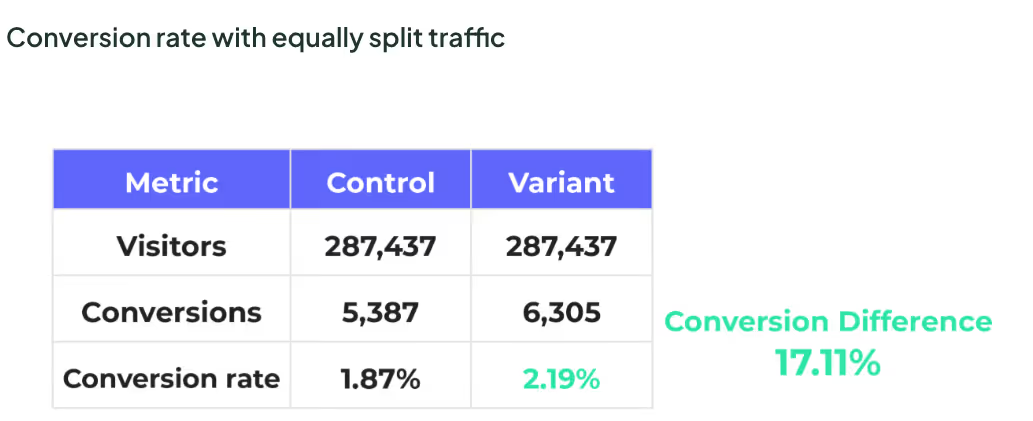
Instead, because Variant B received significantly more traffic, the observed results became distorted.
With this data, it’s impossible to determine whether:
- the simplified checkout design caused the change in conversions, or
- the uneven traffic distribution drove the outcome
The apparent “winner” is a side effect of allocation bias, not user behavior.
Even though the test ran for the planned duration, even though the sample size was large, and even though statistical significance may have been reached, the experiment is invalid.
What caused the SRM?
In this example, imagine mobile users typically convert at a higher rate for this product.
Midway through the experiment, a small update was deployed to fix a mobile rendering issue. The fix unintentionally altered how mobile users were bucketed into the experiment.
As a result:
- Mobile users were more likely to see Variant B
- Desktop users were overrepresented in Variant A
- Traffic allocation drifted without anyone noticing
But, the apparent performance difference from Variant B was not caused by the simplified form. It was caused by who saw it.
If your team had shipped based on the so-called “winning” results:
- Revenue forecasts would be inflated
- Future experiments would be benchmarked against faulty data
- Trust in experimentation would erode when results failed to replicate
For these reasons, SRM is not a minor technical issue, it has major implications on the validity and the trustworthiness of your test results.
And if you can’t try your test results, why even bother testing in the first place?!
How common is SRM?
This example is not an isolated one. In fact, research shows, about 6-10% of all tests run end up with a SRM issue.
Kameleoon’s SRM rate is a bit below this industry average. Of all experiments run on Kameleoon, only about 5.5% have an SRM issue.
We’ve taken a lot of measures to catch SRM issues and pride ourselves on this lower SRM rate.
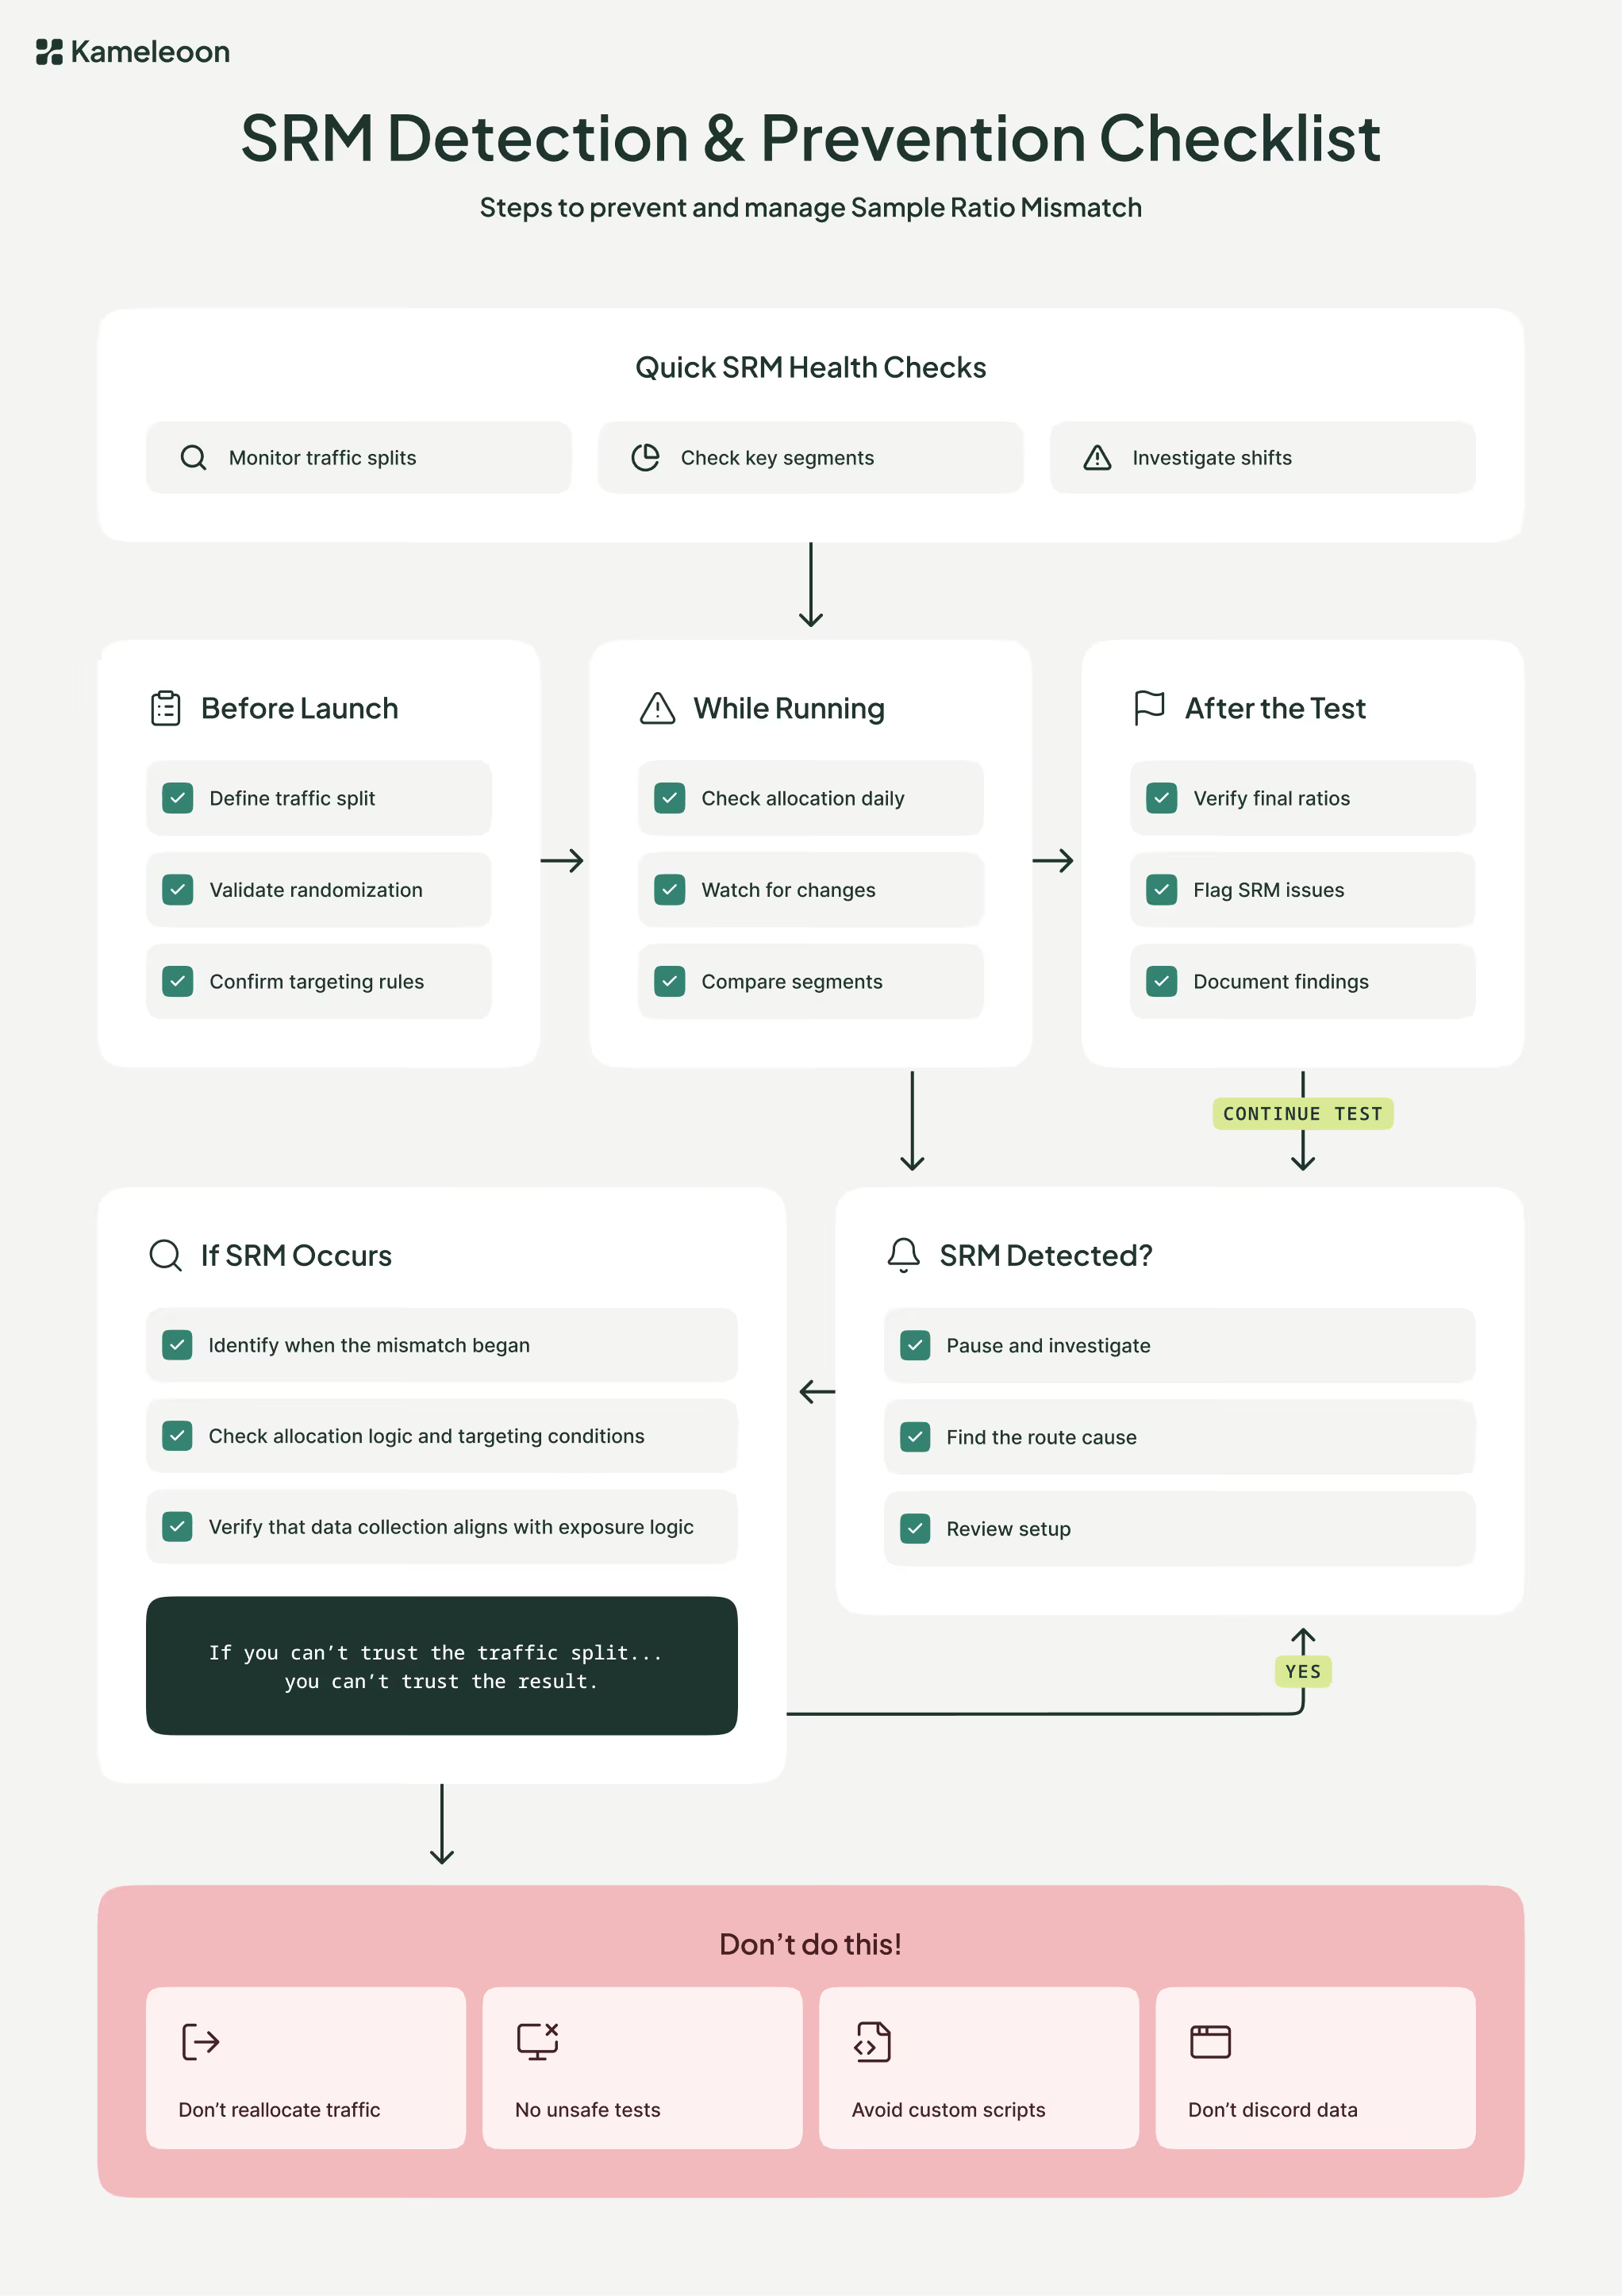
SRM detection and prevention checklist
To avoid SRM, use this checklist before launching, while running, and after completing any experiment:
Quick SRM health checks
- Compare observed traffic splits against intended allocations
- Monitor allocation daily, especially during the first few days of a test
- Break down allocation by key segments such as device, browser, and geography
- Treat sudden shifts in traffic distribution as investigation triggers
Below are more detailed checks for each stage of an experiment:
Before you launch: design and setup checks
- Confirm the intended traffic split is clearly defined and documented
- Validate that randomization logic is consistent across devices and platforms
- Ensure targeting rules are mutually exclusive and logically sound
- Verify that experiment eligibility matches the analysis population
- Avoid relying solely on client-side allocation when reliability is critical
These check points act as important guardrails to help ensure your test doesn't fall victim to SRM.
While the test is running: early warning signals
- Monitor traffic allocation daily during the early phase of the experiment
- Watch for allocation changes after deployments or configuration updates
- Compare allocation across key user segments
- Pause analysis immediately if SRM is detected
Continuing a test with known SRM does not correct the problem. It compounds it.
After the test: trust and interpretation checks
- Confirm the final observed ratio matches expectations before reviewing results
- Treat tests with confirmed SRM as invalid, regardless of statistical outcomes
- Document the root cause to prevent recurrence
- Flag affected experiments clearly in reports and stakeholder communications
If you do not trust the traffic split, you cannot trust the result.
What to do if SRM occurs
If SRM is detected, the safest action is to stop the test and investigate.
Key steps to take include:
- Identifying when the mismatch began
- Reviewing recent deployments or configuration changes
- Checking allocation logic and targeting conditions
- Verifying that data collection aligns with exposure logic
Kameleoon’s in-app reports make this process easier. By using filters, you can quickly identify which traffic segments may be causing the mismatch and determine whether excluding a problematic segment resolves the issue.
In some cases, re-running the experiment with that segment filtered out can restore validity.
In most situations, results from experiments affected by SRM should not be used for decision-making.
Restarting the test after resolving the underlying issue is usually the safest path forward.
You can also refer to the dedicated SRM diagnostic documentation we’ve created to support deeper investigation.
What you shouldn’t do if SRM occurs
If SRM is detected, don’t:
- Reallocate or adjust traffic mid-test, which can worsen the mismatch
- Run cross-device or redirect-based tests where Kameleoon is not installed, as these are test types are especially prone to SRM
- Develop custom variants or scripts that bypass Kameleoon’s allocation logic
- Discard test results automatically without investigating if problem segments can be isolated
- Ignore SRM alerts or notifications
- Implement or trust results from a test with unresolved SRM
- Slice data in an attempt to explain the issue without addressing the root cause
SRM warnings exist to protect the integrity of your experimentation program.
Here’s a flowchart you can use to help you detect, monitor, and prevent SRM:
Avoid Sample Ratio Mismatch in your experiments
Sample Ratio Mismatch is easy to overlook and costly to ignore.
By understanding what SRM is, why it happens, and how to detect it early, teams can protect the integrity of their experiments and the decisions built on them.
Strong experimentation is not just about running tests. It is about trusting the data that comes out of them.
To make accurate, data-driven decisions, you need to check for SRM and attempt to remove, or filter out, any occurrences of it. Doing so could save you from implementing so-called "winning" tests that are actually big losers.
So, don’t be the biggest loser; pay attention to Kameleoon’s SRM in-app alerts, and attempt to remove and resolve SRM from your tests.