
A/B Testing: What traffic volumes do you need for reliable results?

![]() ACADEMY/A/B testing training blog
ACADEMY/A/B testing training blog
It’s essential to allocate the right traffic volume to your A/B tests if you are to obtain reliable results. Depending on the conversion goals and the confidence levels you’ve set, the minimum traffic required for a significant experiment may vary. So, how should you calculate the traffic volumes necessary for obtaining statistically significant results from your A/B test.
1 Four parameters to take into consideration
The conversion rate of your reference page (P1)
This is the current conversion value for the main goal of your test - for example: a 3% click rate on a button you’re testing.
The minimum effect the variation is expected to have on the conversion rate (P2)
If you choose 10%, you’re looking to detect a conversion variation of over 10% (whether this is an increase or a decrease). The smaller the difference you’re trying to detect, the greater the number of visits must be. Conversely, the more significant the difference you’re trying to detect, the faster your test will be and the lower the number of necessary visits will be for obtaining reliable results.
This axiom may appear counterintuitive on first reading, but it is simple to understand. If you are aiming for a large increase, let’s say over 20%, then the statistical engine doesn’t need many visits or much time to identify whether or not your variation outperforms your reference page by that amount. You will very quickly know for certain whether it is beating your reference page by more than 20%.
This type of increase can typically be obtained on CTAs that don’t involve a purchase, such as a newsletter subscription, or on landing pages.
Conversely, if the expected increase is likely to be much smaller (typically at the end of the conversion funnel around purchases), the number of visits necessary to guarantee a reliable result will potentially be much higher.
The confidence level for which an effect will be detected (P3)
This data represents the percentage of chances that the change you are hoping for will be detected. In statistical literature, the standard value recommended for this parameter is 80%, meaning that there is one chance in five that this effect will not be detected, even though it does actually exist.
The confidence level for which an effect will be detected even though it doesn’t exist (P4)
This parameter represents the percentage of chances that a false positive, especially in A/A tests will be detected. In other words, this is the percentage chance of detecting an effect which doesn’t exist in reality. The standard value recommended for this parameter is 5%, which means that you are giving yourselves one chance in 20 that the detected effect will be false.
To ensure the reliability of your test, you have to increase the confidence level for which an effect will be detected (P3) and decrease the level for detected a false positive (P4). Conversely, if you decrease P3 and increase P4, the number of visits required for your test will be lower, and the results will be less reliable.
2 Calculating the number of visits necessary for a reliable A/B test
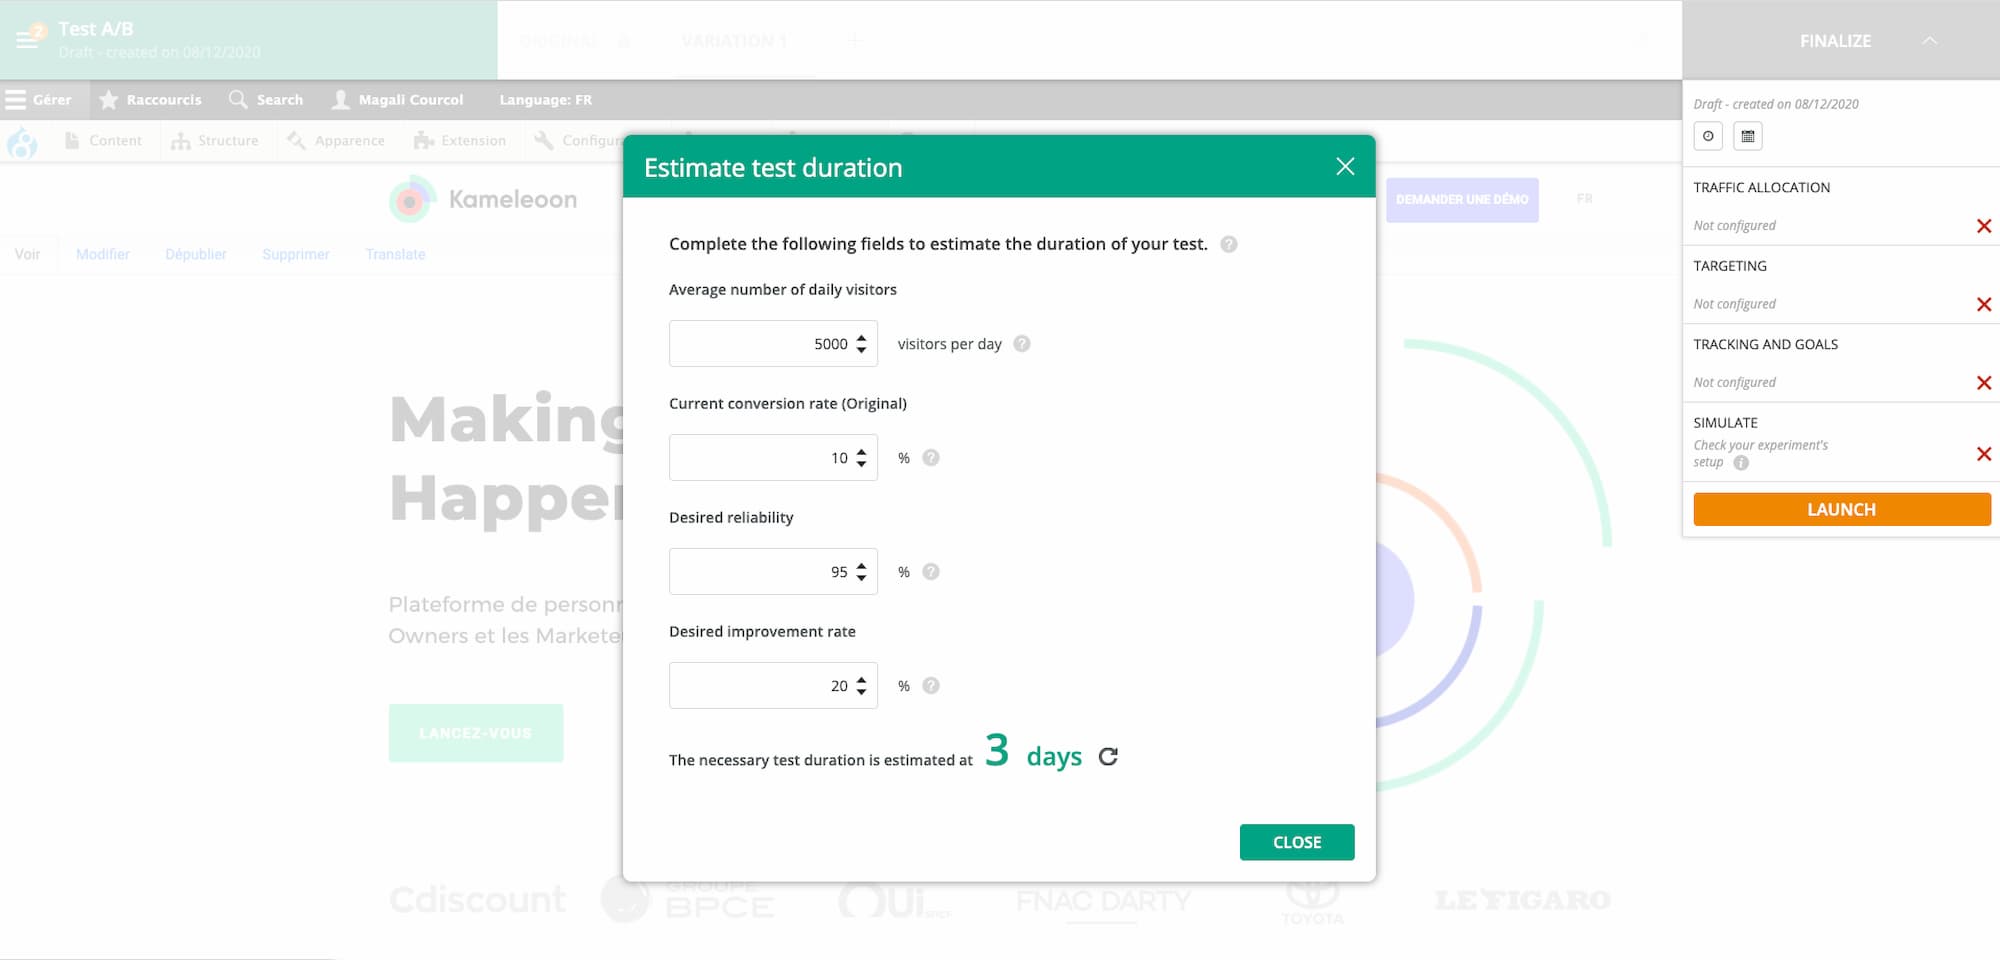
Once you’ve defined these four parameters, you need to perform the statistical calculation that will give you the average number of visits required for each of the variations. Good A/B testing platforms provide you with the results directly through a tool that estimates the necessary traffic or time. In Kameleoon, this calculator can be found in the test launching window.
Remember that ‘necessary visits’ means visits that have been part of the test – rather than the total of all visits to your website.
Now let’s illustrate the necessary traffic volume with a few simple examples based on setting the P3 and P4 confidence levels at the standard 80% and 5%:
- For the tests whose current conversion rate (P1) is high (30%, for example) and whose potential expected increase (P2) is also high (over 20%, for example) the minimum number of visits necessary per variation to have a statistically significant result is barely 1,000 (929 to be precise). These tests are therefore accessible to almost everyone.
- For the tests whose initial conversion rate (P1) is lower (for example 5%, for sending a form) but whose potential increase (P2) remains high (over 20%, for example), the minimum number of visits is around 7,500 per variation. If the expected increase (P2) is lower, the traffic required soars: dropping from a 20% to a 10% minimum effect on the conversion rate makes the number of visits necessary for each variation rise to over 30,000, so four times more.
- Finally, for the tests whose initial conversion rate (P1) is even lower (for example 2%, as at the end of the conversion funnel) and whose expected potential increase (P2) is also low (5%, for example), the level rises to almost 310,000 visits per variation. This means that the number of e-commerce sites able to run this kind of test is limited.
3 A/B testing on a website with low traffic
Our examples show that the traffic volume required for most A/B tests are not low, if you want statistically reliable answers. Before getting started, make sure you know what you’re getting into and understand the kind of tests you’re able to run on your site.
Clearly, brands with low traffic websites can carry out A/B testing as long as they focus tests on landing pages or on modifications for which the conversion increases are potentially large. A website with low traffic can A/B test banners, newsletter subscriptions, or forms to fill in, if it is a B2B site with a qualified audience. Tests on the conversion funnel can be run, as long as the potential for improvement is significant. This is particularly the case on recently created websites.
However, for conversion funnel or add to cart tests, for example, where the ability to obtain increases in conversion rates is much more limited, a substantial number of visits is required. Consequently, such tests are limited to high traffic e-commerce or media sites.
Finally, remember that a test only yields reliable results once it has been completed and all visitors have been tested. Though the temptation may be strong, if you look at the results before the end of the test, any conclusions you draw will have no statistical value, even if the results show a confidence index of over 95% at that given moment (for more information, see our article about the statistical value of an A/B test).
![]() ACADEMY/Return to our A/B testing training course.
ACADEMY/Return to our A/B testing training course.


