How manage personalization experience performance in real time [Product Release]

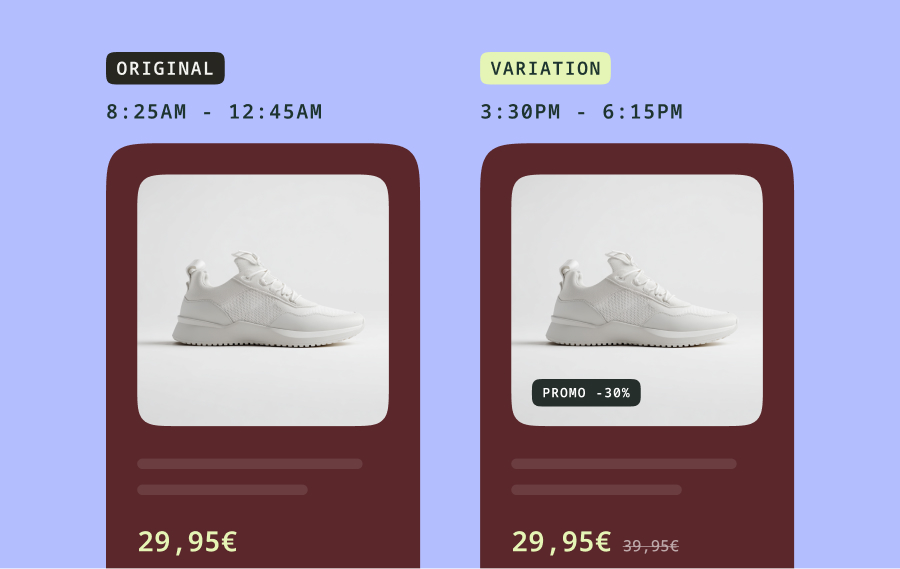
Personalization provides an opportunity for marketers who are committed to meeting and adapting to the growing information and support customer segmentation across all channels and devices (web, mobile and apps).
Unlike A/B testing, which is an experiment run on a website or an application to test user hypotheses for optimizing user experience, personalization is a marketing strategy that involves individualizing experiences, messages and offers based on each visitor’s behavior and purchase intention. So it makes sense for marketers to have at their disposal a reporting tool dedicated exclusively to personalization, separate from the one used for testing. This should give them access to the relevant indicators they need to improve and increase the performance of the personalization experiences they offer their customers: income by visitor, test sample, exclusion rules for a given action, return on investment (if the action has an underlying cost), etc. Kameleoon is integrating a new reporting page dedicated to personalization to help brands build even better personalized customer journeys and thus give them the chance to retain or gain new customers.
The key features of our new reporting solution for decision-makers:
- Analyze personalization experience results at a glance
- Access a detailed analysis of audience behaviour to obtain in-depth and directly actionable knowledge
- Monitor and manage the performance of personalization experiences in real time
Analyze personalization experience results at a glance
To be more effective, it’s important to be able to read and instantly understand the main performance factors of your personalizations. As soon as you arrive on the results page of the Kameleoon personalization module, it’s possible to find a simple answer to the question “is this personalization working properly?” and to immediately identify the changes in the main KPIs.
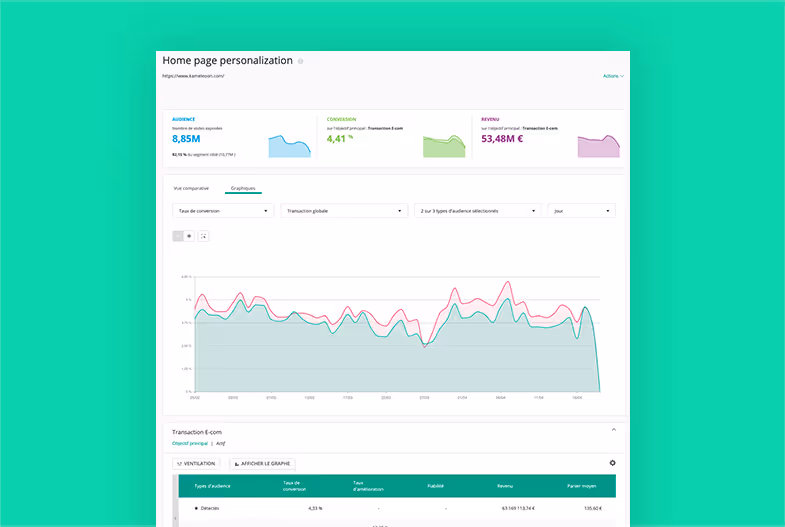
Campaign performance at a glance
The main performance indicators (audience, conversion rate, income) are highlighted to gauge the success of the personalization.
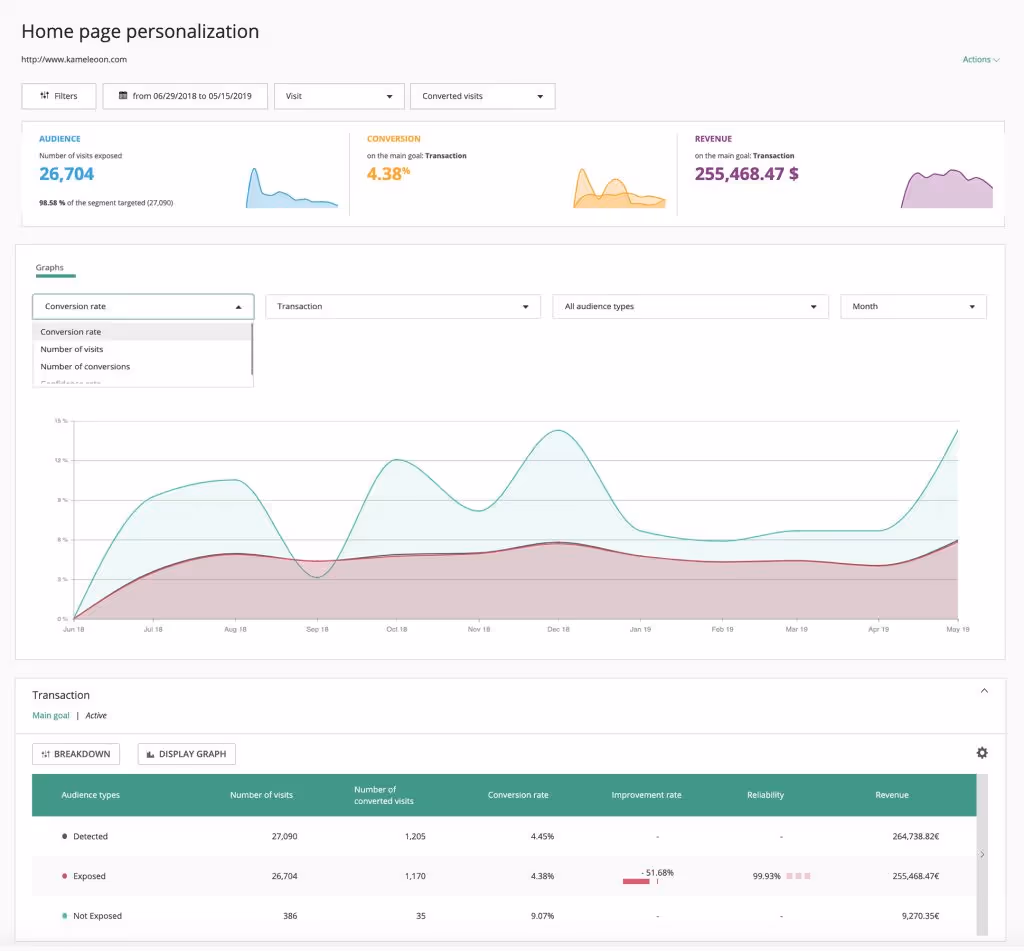
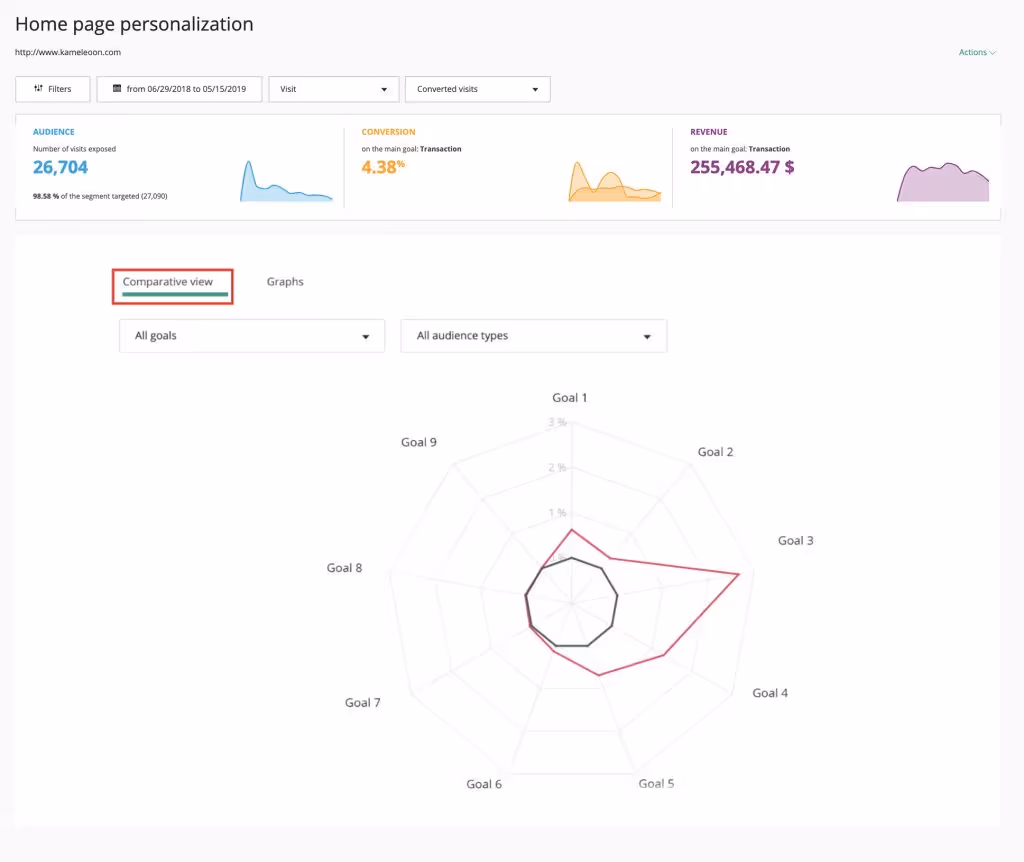
And, since every minute counts, a comparative view lets you identify experience performance for all associated goals in record time. Within each goal table, you will find many indicators, including the average improvement rate for visitors exposed to your personalization, along with a confidence interval.
Intuitive and smart data visualization
The results page presents a number of graphs: conversion rate, number of visits, number of conversions, trust rate, etc. The results are easier to read and interpret in graphic form. Our users set the period and KPI they need analyzed. Our zoom feature can focus the analysis on the data that stand out.

Obtain in-depth and directly actionable knowledge of visitors
The success of any personalization strategy is contingent upon your knowledge of your visitors and the segmentation you have defined to identify your most valuable segments. So, gaining better knowledge of the segment targeted by your personalization action is one of the aims when analysing the results of your ongoing personalization campaigns. The results page is a mine of information that will help you understand your visitors.
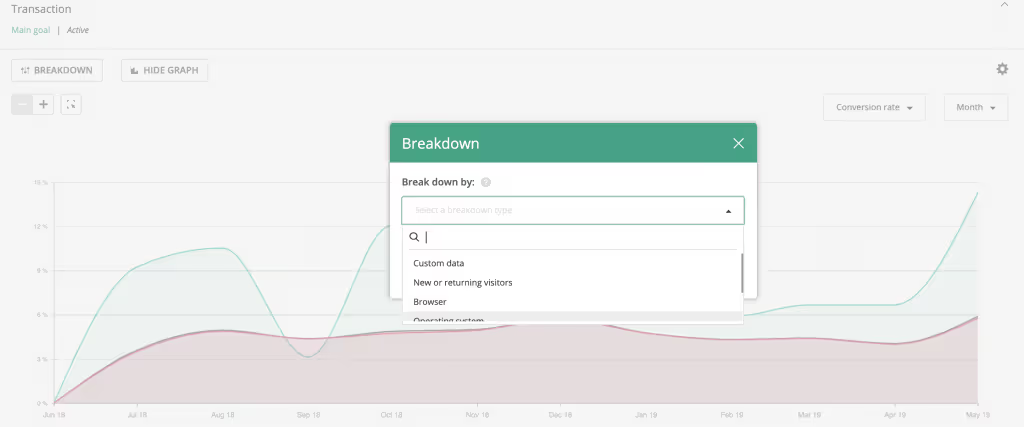
Deep and detailed analysis
It’s possible to filter or break down the results using a multitude of criteria: type of visitor, browser, time on site, or any segmentation data added via personalized data. This provides a detail and depth of analysis that will be essential in better understanding your target along with their needs and behaviour. By selecting relevant segmentation criteria in the filters, it’s possible to isolate and analyse the results that are specific to this target.
This makes it easy to identify the impact that different segmentation criteria (traffic source, geolocation, pages visited, time of visit, etc.) have on conversion rates. New personalization opportunities are also easily identifiable.
Manage personalization experiences in real time
Real time is a vital factor in the success of a personalization strategy, since the goal is to offer visitors experiences that are individualized to their needs. For effective campaign management, it is therefore essential to assess the results in real time. Data linked to personalization performances are displayed on the results pages as soon as they’re published. This guarantees real-time campaign monitoring. This feature is quite rare, so worth mentioning: many analytics solutions will make you wait several hours before showing you the latest data. The results page is accessible from all mobile devices so that our customers can keep an eye on their campaigns at any time, even when they’re on the move, and take any required action. And just like our A/B testing reporting page, the personalization reporting page can be entirely customized to suit everyone’s needs!
Conclusion
The dedicated reporting feature in Kameleoon’s personalization tool enables marketing teams to make the right decisions to continuously increase campaign performance using detailed knowledge of their audiences. This result is the construction of personalized customer journeys to meet the needs of consumers in the digital world. Here at Kameleoon, we are committed to constant innovation to offer our customers the highest performing and most robust testing and personalization solutions on the market. For example, at the moment we are working on a new system of automated alerts, so our customers don’t have to spend all their time with their eyes glued to their reporting tool! Check back in June for the unveiling of this new feature. Until then, enjoy using Kameleoon for your personalizations !