
Are You Stopping Your A/B Tests Too Early?
![]() ACADEMY/A/B testing training blog
ACADEMY/A/B testing training blog
In A/B testing, your experiments need to run for the appropriate amount of time for you to get results that lead to actual business outcomes.
But what is an appropriate amount of time?
Like everything else in experimentation, it depends on your sample size, traffic volume, statistical significance, a proper representation of your customers and more.
In This Article, You Will Learn About:
- How long your A/B tests should run for
- How to calculate your A/B testing duration
- How to make each A/B test count
- Data variability in your experiments
Why test duration matters in A/B testing
Finding the appropriate A/B testing duration for your experiments is akin to Goldilocks finding the right porridge in the home of the three bears.
When your experiments run for a short time, you run the risk of getting false positive results. Because your A/B test runtime was too short, it never accounted for variability in seasons, business cycle, holidays, weekdays, and other factors that influence customer behavior.
When you declare a winner from an experiment with a short duration, you run the risk of implementing changes that have no effect on your site’s baseline conversions. Even worse, it could lower your website’s conversion rates and revenue.
On the other hand, running experiments for too long comes with its own set of challenges.
The longer your A/B testing duration, the higher the chances you will run into issues around cookie deletion. Cookies are often used to correctly bucket users into segments so that they continually see the same variation. Cookie deletion means you may show the control to a visitor who has already seen the new variation, polluting your test data and contributing to an overall poor user experience.
At the same time, browsers are phasing out web cookies and enabling automatic deletion after 7 days. With these changes, experimenters are no longer able to rely on cookies to properly bucket users.
To prevent issues with running your A/B tests too long and issues with cookies, you can move your experiments server-side. In Kameleoon, the server-side snippet lets you run experiments without any cookie noise. It helps you identify and remember returning visitors so you can bucket them correctly into experiments.
It also ensures that you get accurate data every single time. Moving experiments server-side gives you the freedom to run experiments that take longer. If you are not technical, you will require a developer to program server-side experiments.
Factors affecting A/B testing duration
If your A/B testing duration can’t be too long or too short, how long is your A/B test supposed to run?
Experts say the sweet spot is a minimum of 2 business cycles.
The duration of a business cycle depends entirely on your type of business. Knowing your sales cycle, conversion rates and traffic volume will help you calculate how long you should run your A/B tests to get valid results that lead to actual outcomes.
Shiva Manjunath, Experimentation Manager at Solo Brands, says:

Traffic Volume
When calculating how long to run an A/B test, the traffic volume of your website becomes important - especially on the page you plan to experiment on.
The higher your traffic volume, the shorter the duration of your A/B tests. Because you have many visitors, you can bucket more people into your A/B test. This means not only will you reach statistical significance sooner, you will hit the minimum detectable effect (MDE) you calculated faster.
The opposite is true for low-traffic websites. When you do not have enough visitors, it will take longer to run and get results from your experiment.
Another crucial thing to understand about traffic volume is the amount of visitors the page you plan to test gets.
While your overall site traffic may be high, it starts to drop the deeper visitors navigate into your site. For example, your homepage will have a higher traffic volume than your checkout page.
For tests that truly move the needle, like optimizing the customer journey on your ecommerce store, you will require a large traffic volume to get results.
Sample Representation
When you run A/B tests, your experimentation sample is meant to be a representation of your overall audience.
For your experimentation sample to be a good representation of your audience, you need to run your experiment long enough for you to account for all the factors that make your audience unique.
One such factor is traffic source. Your visitors come from different sources — direct, email, social media, search, paid ads, etc. Your experimentation sample needs to also come from these sources to be more representative of your audience.
For example, your paid ads bring in users who convert at a higher rate than users who come via search. Running an experiment during a paid ad campaign means your sample will have more of your paid ads audience which will skew data that you get from your experiment.
Avoid running experiments during campaigns as this will skew your traffic sources and experimentation data.
Another factor that affects how much your sample represents your entire audience segment and ultimately, how long you will run your experiment is the length of your sales cycle.
Visitors who convert on their first visit are rare. Most of your visitors will take several days and weeks to make their purchase. When you know how long your sales cycle is, you can factor this time into your A/B testing duration.
If your sales cycle is 2 weeks with the weekend accounting for more conversions than weekdays, running an experiment for 1 week doesn’t account for your sales cycle. The data you get during this period will not be representative of your audience’s behavior nor will it lead to positive changes when implemented.
To get accurate data, you need to run your experiments for 4 weeks to account for all the variations that occur.
Statistical Significance
Statistical significance impacts how long you should run your A/B test.
The first way it affects how long you should run your A/B test will be using it as a parameter to stop tests.
A/B testing tools use a statistical significance threshold of 95% or higher. This threshold tells you that there is a probability (0.95) that the difference between the results of your variation is not due to chance.
You may be tempted to use this threshold as an indication to stop your experiment. But there is still a chance that when you leave your experiment to run after you hit this threshold, the results may change.
How to Calculate how long an A/B test should run
There are many pre-test calculations you can do to determine how long an A/B test should run.
Your A/B testing tool often has a testing duration calculator built in. Your experimentation tool may calculate how long your experiment should run using sample size or statistical significance.
When it uses sample size, your calculator tells you how long your experiment will run based on the sample size you currently have. It basically tells you how long it will take your experiment to conclude based on the traffic you get to that page, conversions, and confidence level.
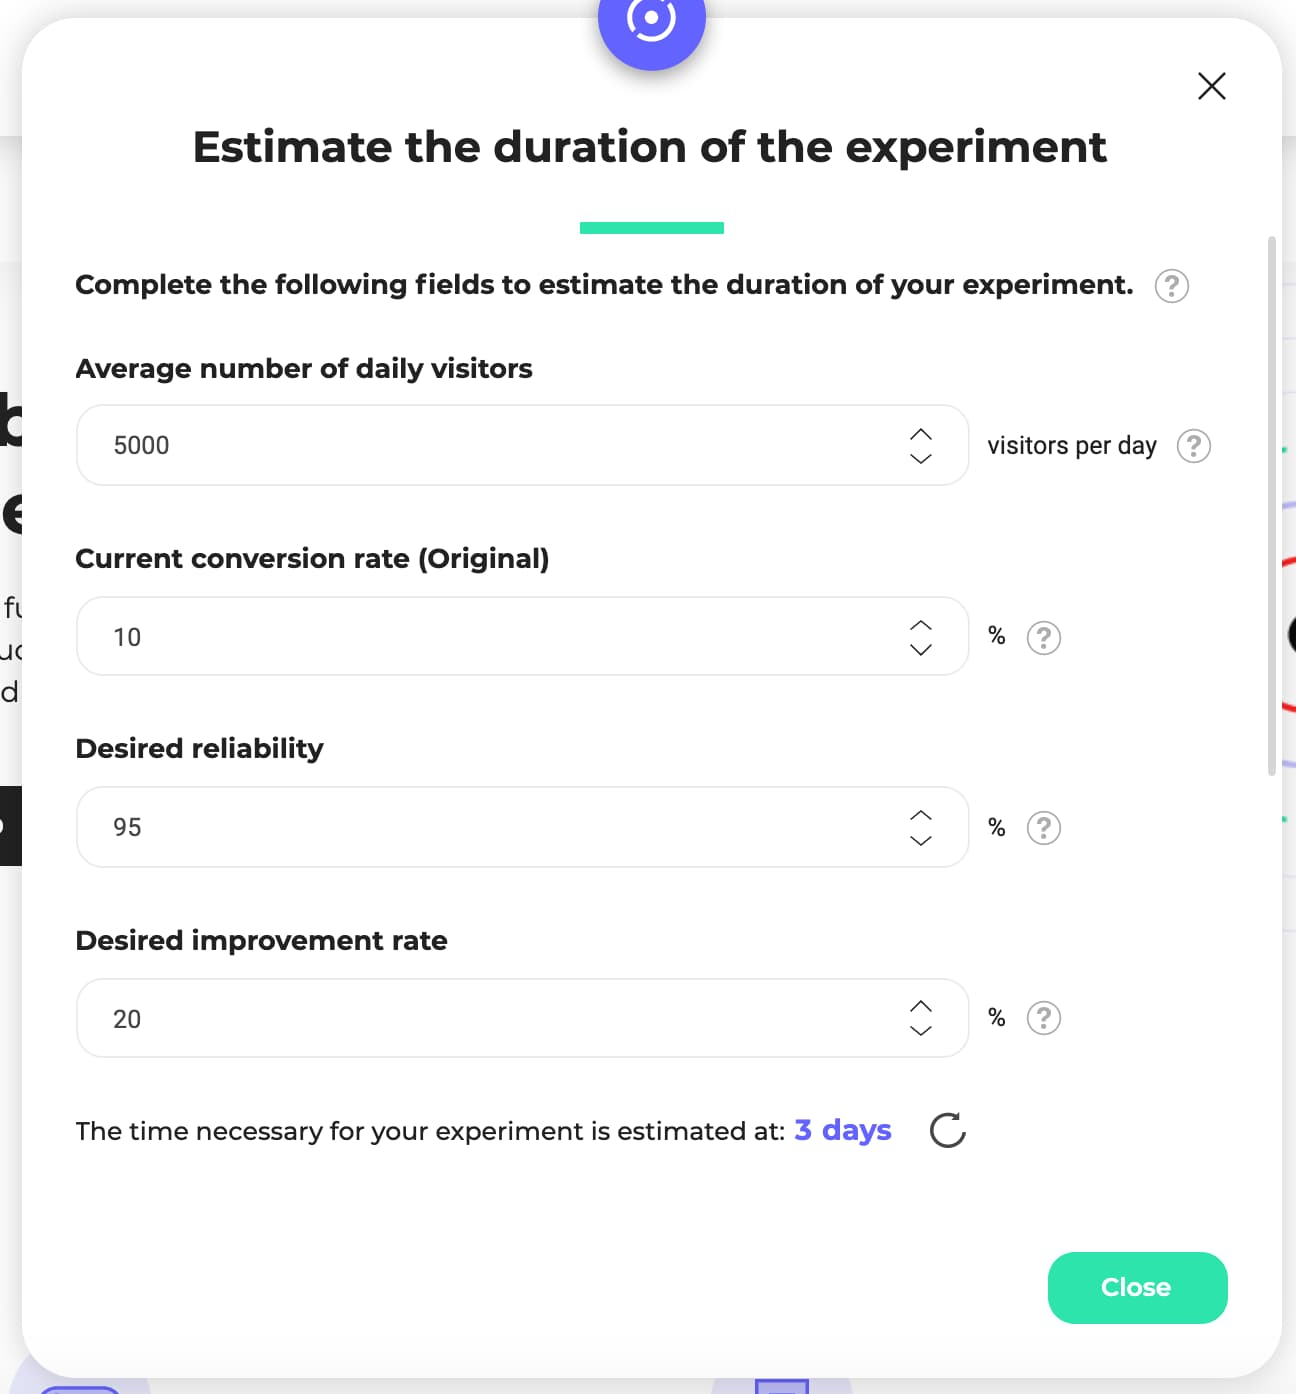
In Kameleoon, you can estimate how long your A/B test will run for with the in-app test duration calculator. To estimate the duration of your test, input
- The number of daily visitors the page gets
- Your baseline conversion rate
- Confidence level
- The improvement you want to see
Kameleoon will tell you how long your A/B test will run for based on the parameters you included.
When your tool uses statistical significance, it tells you how long your A/B testing will take. This often depends on what type of statistics your tool uses - Frequentist, Bayesian, or CUPED.
While most A/B testing calculators are fine for most pre-calculations, there are some caveats you should be aware of.
Shiva Manjunath says:
You can remove this caveat by running bandwidth and MDE calculations. Doing this helps you calculate how long your A/B test should run, what to expect with your experiment, and how big of an impact your test will have.
Lucia van den Brink, Lead Consultant at Increase Conversion Rate, says:

Balancing A/B Test Duration and Practical Constraints
Because A/B tests are focused on improving outcomes for your customers that lead to increased revenue, you have to balance each test with business constraints.
In many cases, you do not have endless resources to run as many tests as possible. You want to make each A/B test count but that may not be the best use of your limited resources.
Shifting your mindset to more volume over quality gives you a higher chance of running more A/B tests that improve your revenue. Another advantage of thinking of this mindset is that you gain more insights, the more experiments you run. These insights enable you to plan and test future changes that lead to better outcomes for your business.
Shiva Manjanuth puts it best:
While cutting down on your A/B testing duration may seem like a good way to balance experiments with practical constraints, it never really is. Pre-validating changes you want to A/B test can help you focus on tests that directly impact the bottom line. This way you are spending resources on areas where it counts.
Lucia van den Brink, puts it like this:
Controlled-experiment Using Pre-Experiment Data (CUPED) is another analysis method you can employ to cut down on A/B testing duration without sacrificing data and result validity.
First, you need to collect data on the goals you will use in your experiment for at least 2 weeks. Then you can use this data in CUPED during your experiment to cut down on A/B testing duration without worrying about the validity of your results. In the Kameleoon App, go onto the Actions menu on the results page of a campaign and click on “Enable CUPED” to turn it on.
Another way to test faster amid business constraints is sequential testing. While sequential testing is a more advanced technique, it can help you cut down on A/B testing duration as you can peek at set points.
This allows you to announce winners for your tests early without waiting until the test concludes. Being able to call tests early allows you to implement changes or gather insights faster. You can also save on limited resources as you don’t have to wait until the test concludes to start implementation or learning.
Check the variability of data during A/B tests
There is going to be variability in your data during the early days of your A/B tests.
This is normal as the novelty effect and impact of outliers are felt during the first days of your experiment. The novelty effect in your challenger may cause it to have a higher conversion in the first days of your experiment.
Outliers happen and you cannot account for them. For example, a visitor who had already seen your website several times in the past and got bucketed in an experiment can buy multiples of a product on the first day of your test. This may throw off your data.
The variability in your A/B testing data starts to fall away as you collect more data.
Lucia, on variability in your testing data, says:
While data fluctuations in the early days are normal, it will start to normalize the longer you run your A/B test.
Best practices for A/B test duration
There is no exact answer to “how long should your A/B test run” because your business situation will differ from others. But you need to keep the following in mind when you calculate how long your experiment should run:
- Run your test for at least 2 business cycles (usually 2- 4 weeks). This helps to remove seasonality and other external validating factors that impact the data you get from your experiment. You can learn more about how Kameleoon keeps your experiment data accurate!
- Use an experiment sample representative of your audience - account for all traffic sources where your visitors come from and new/returning visitors in your sample size.
- Use a large enough sample size to lower the disparity between the variations you will be testing.
- Do pre-test calculations to estimate how long your experiment will likely run and understand what to expect when you launch your A/B test. Your A/B testing tool may offer a way to calculate either sample size or statistical significance. In Kameleoon, you can estimate how long your experiment should run for before you start. Input traffic, confidence level, your current conversion rate and desired conversion rate to get how long your experiment will run in the Kameleoon app.
- Advanced experimentation techniques like sequential testing and CUPED can help you reduce how long your A/B testing should run amidst budget constraints.
To learn more about test duration in A/B testing and to learn how Kameleoon solves common data accuracy challenges, check out our data accuracy page.