Login
English

Select your language

English
Français
Deutsch
Platform

PROMPT-BASED EXPERIMENTATION

Optimize any website by chatting with PBX, Kameleoon’s AI. Learn more

SOLUTIONS
Experimentation
Feature Management
KEY Features & add-ons
Mobile App Testing
Recommendations & Search
Personalization
specialities
AI in Experimentation
Single Page Application
Data Security & Privacy
Data Accuracy
Integrations & APIPartners ProgramSupportProduct Roadmap
Solutions
for all teams
Marketing
Product
Engineering
Data Scientists
For INDUSTRIES
Healthcare
Travel & Tourism
Financial Services
Media & Entertainment
E-commerce
B2B
Automotive

Samsung gains autonomy and speed in its most advanced tests with PBX

read the success story
PlansCustomersResources
Book a demo
Book a demo

Quick links

Heading 2
Book a demo
Book a demo

All resources
The 12 Kameleoon days of Christmas: part 7

The 12 Kameleoon days of Christmas: part 7

Fred De Todaro
Published on
December 9, 2020
Product Updates

Article

Ensuring that your experimentation results are reliable is vital, and stopping your test too early is one of the most common mistakes that people make when running programs.

Today’s Kameleoon hidden feature spotlight explains how our platform gives you all the data you need to make an informed decision on when it is time to end your experiment and still receive reliable results.

1 Confidence stability over time

Testing results need to reach a significance level before they can be considered reliable - as we describe in our in-depth blog on when to stop a test.

However, as the blog says, simply hitting a significance level of 95% isn’t enough on its own to necessarily give you reliable results. You need this confidence level to remain stable over time - you have to look at the trends in your results, rather than simply pressing stop as soon as you hit your target.

Kameleoon gives you immediate access to the full range of data for each and every one of your KPIs, allowing you to make more informed decisions.

Measuring confidence stability over time

​

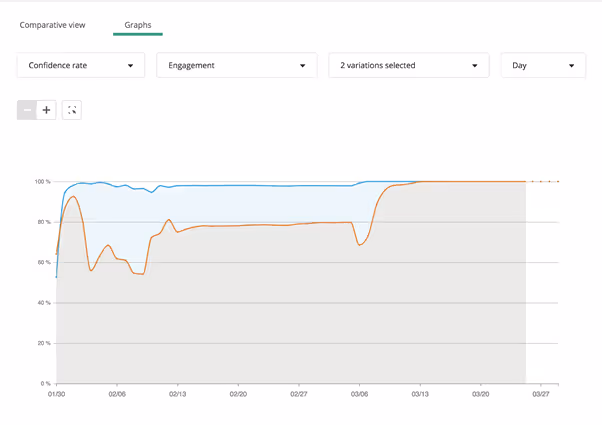
At a high level the platform provides a graphical view of reliability. In the example above the significance rate is almost at 90%, however, only one box is illuminated, which means that the "stability trend" we are looking for is not yet there, showing that results are not yet stable, making them unreliable. Three illuminated boxes mean that the significance rate has been fluctuating by less than 5% over a period of seven days, and the experiment can then be stopped with high confidence towards the data displayed.

You can also view reliability over time as a graph, showing how trends evolve. The blue line shows confidence levels - as you can see it would have been tempting to end the experiment much earlier, after one or two weeks, but in fact the curve only flattens much later. This means that the results have stabilized and that you can use this data with confidence.

Measuring confidence stability over time

​

Find out more about how Kameleoon measures and displays statistical significance in our developer documentation - and come back tomorrow to learn how we make it simpler to view and organize your results against KPIs.

ebook-12-features-kameleoon

,

Read more in the series here:

  • Day 1: Visualization of modified/tracked elements on a page
  • Day 2: Reallocating traffic in case of issues
  • Day 3: Simulation mode: visit and visitor generator
  • Day 4: Click tracking: automatically send events to analytics tools such as Google Analytics
  • Day 5: Adding a global code to an experiment
  • Day 6: Excluding time periods from results
  • Day 7: Measuring confidence stability
  • Day 8: Switching to custom views
  • Day 9: Using custom data for cross-device reconcilation
  • Day 10: Personalization campaign management
  • Day 11: Adding CSS selectors
  • Day 12: Changing hover mode

Explore our resources

Addressing customer concerns: 22 online banking examples to drive better test ideas

Banking

Article

PBX multitasking and waiting time for faster, more fluid workflows

Article

Risk-free A/B testing for banks and financial services

Article

“We needed a way to assess visitor interest more accurately. With manual scoring, lead quality was too low. We chose Kameleoon for its AI, which precisely targets visitors based on their interest in our cars.”

Caroline Josse
Head of Marketing Digital & Acquisition at Toyota

“This campaign shows the multiple benefits of artificial intelligence for personalization. Toyota’s teams have been completely convinced by the performance of Kameleoon’s AI personalization solution and are expanding this approach across the customer journey.”

Caroline Josse
Head of Marketing Digital & Acquisition at Toyota
before ai
Book a demo
Book a demo
Book a demo
Book a demo
Experiment your way

Get the key to staying ahead in the world of experimentation.

[Placeholder text - Hubspot will create the error message]
Thanks for submitting the form.

Newsletter

Platform
ExperimentationFeature ManagementPBX Free-TrialMobile App TestingProduct Reco & MerchData AccuracyData Privacy & SecuritySingle Page ApplicationAI PersonalizationIntegrations
guides
A/B testingVibe ExperimentationFeature FlaggingPersonalizationFeature ExperimentationAI for A/B testingClient-Side vs Server-Side
plans
PricingMTU vs MAU
Industries
HealthcareFinancial ServicesE-commerceAutomotiveTravel & TourismMedia & EntertainmentB2B & SaaS
TEAMS
MarketingProductDevelopers
Resources
Customers StoriesAcademyDev DocsUser ManualProduct RoadmapCalculatorWho’s Who
compare us
OptimizelyVWOAB Tasty
partners
Our Partner EcosystemBecome a PartnerIntegrations DirectoryPartners Directory
company
About UsCareersContact UsSupport
legal
Terms of use and ServicePrivacy PolicyLegal Notice & CSUPCI DSS
© Kameleoon — 2025 All rights Reserved
Legal Notice & CSUPrivacy policyPCI DSSPlatform Status