How to avoid common data accuracy pitfalls in A/B testing


The experimentation landscape is rapidly evolving. Teams no longer simply run A/B tests.
Instead, experimentation has expanded into AI-generated experiences, prompt-based inputs, adaptive algorithms, and increasingly autonomous optimization systems.
With modern platforms, like Kameleoon’s PBX, teams across marketing, product, and design can quickly launch prompt-based experiments, often without writing a single line of code.
Designing and deploying a test is no longer the hard part.
Running a trustworthy test is.
Despite advances in AI, reliable results still depend on a solid understanding of statistical rigor and data accuracy.
Without this important foundation, results that appear to be strong can be biased by noise or flawed assumptions.
When decisions are based on unreliable data, teams may ship ineffective experiences, misallocate resources, undo real gains, and ultimately lose leads, conversions, and revenue.
Over time, these mistakes can erode trust.
Confidence in individual test results drops first, damaging credibility and reputations. Eventually, confidence in the experimentation program itself weakens, making experimentation harder to defend, fund, and scale.
To help save you from these issues, this article details the most common data accuracy pitfalls and how to avoid them in an evolving AI-enabled experimentation landscape.
The top-seven risks of data accuracy in experimentation
To ground this guidance in real-world experience, we interviewed Ron Kohavi, former Vice President and Technical Fellow at Microsoft and Airbnb.
Ron has run thousands of online experiments and documented recurring failure modes in experimentation programs. His insights are captured in the book Trustworthy Online Controlled Experiments and reinforced through decades of applied research and practice.
He’s also published dozens of papers on the topic, and offers a must-take course on accelerating innovation with A/B testing.
Adding a grounded practitioner’s perspective, Deborah O’Malley, founder of the experimentation resource, GuessTheTest, shares practical considerations for teams operating in real constraints with limited traffic, agency environments, and increasingly AI-assisted workflows.
Together, they outline seven critical data accuracy and test trustworthiness pitfalls that continue to derail experimentation programs, and explain how to avoid them. Their strategies are detailed below and can be accessed in this webinar replay.
Pitfall #1. Interpreting p-values incorrectly
In A/B testing, statistical significance is a metric used to determine whether a test result is trustworthy and, therefore, a real winner.
Statistical significance is evaluated using a p-value.
A p-value is among the most commonly misunderstood concepts in experimentation, making it important to clarify what it is and how it works.
Interpreting a p-value correctly requires that you understand a core assumption of the scientific method: that until suggested otherwise, there is no difference between variations. They convert equally.
This assumption is known as the null hypothesis.
The p-value answers the question: if there’s actually no difference between variants, how likely is it the difference could’ve happened just by chance?
If that probability is 5% or less (p ≤0.05), the null hypothesis is rejected and the result is considered statistically significant.
It’s important to get this idea straight: the p-value doesn’t tell you that the winning variant is meaningfully better, nor does it show that the result is replicable.
It only indicates that the observed result is unlikely, assuming no real difference existed in the first place.
However, testing teams frequently fall into the same traps, including:
- Declaring a winner before confirming the change is real and meaningful
- Ignoring how much uncertainty exists in the result
- Treating statistical significance as a final verdict of test trustworthiness instead of as the starting point
In AI-generated experimentation, this problem can become amplified.
When tools automatically create many variations at once, each variant tends to receive less traffic. With smaller samples, random fluctuations in user behavior can look like real improvements, making the variations appear “statistically significant” when they’re not.
If these same variants were shown to a larger audience, the apparent gains would be likely to disappear because they were actually artifacts of noise, not genuine preference based on a large, representative sample of users.
So more variants tends to equal smaller samples, more noise, and increased likelihood of a false positives test result.
A false positive result
A false positive occurs when a test appears to show a real difference, even though no meaningful difference exists.
Even in mature experimentation programs, the risk of false positives is surprisingly high.
In fact, research by Ron Kohavi shows that the False Positive Risk (FPR) can reach 26.4%, even at highly advanced organizations.
In other words, more than one in four “statistically significant” wins may not actually be winners at all.
As this chart shows, this risk carries through even into some of the most credible testing organizations, like Microsoft, Booking.com, Google, and Netflix:
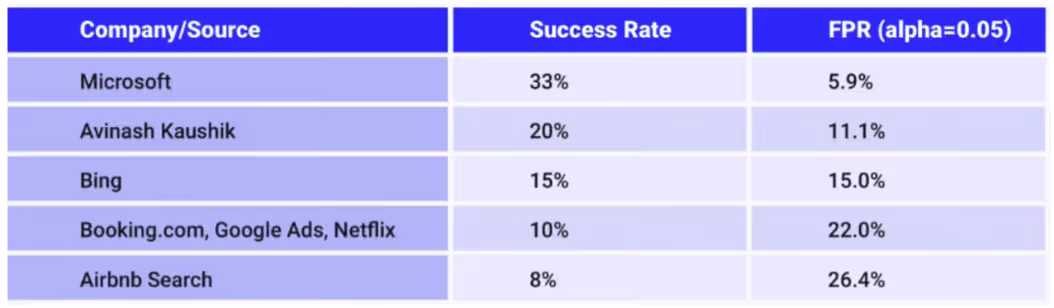
“Just because a result is statistically significant doesn’t mean you truly have a winning test. A statistically significant result can be wrong 26.4% of the time.”
— Ronny Kohavi, A/B Testing & Experimentation Expert
Therefore, relying on statistical significance alone is not enough.
What to do instead of relying on statistical significance
Statistical significance tells you something happened that may be worth investigating. It doesn’t tell you whether you should act on the result.
To accurately interpret results, you should not only verify statistical significance, but also:
- Evaluate effect size, or conversion difference alongside statistical significance
- Use confidence intervals to understand uncertainty
- Ask whether the observed lift is large enough to justify change
- Consider your program’s historical success rate when assessing false positive risk
One of the most effective ways to reduce false positives is ensuring your experiment has adequate statistical power.
Pitfall #2: Running tests with insufficient statistical power
In A/B testing, statistical power measures how often a test will successfully detect a real difference in conversions, when one actually exists.
In practical terms, power answers this question: if this change truly improves performance, how likely is it to show in the experiment?
A commonly accepted benchmark is 80% power, meaning that if a real effect, or conversion difference exists, there’s a 80% chance of detecting it.
When tests run with far fewer users than required, you can still get statistically significant results. But, according to experimentation expert Georgi Georgiev in his article on test trustworthiness, the “win” is an illusion because of the small sample.
Studies with small samples tend to be underpowered meaning they don’t have enough power to accurately detect conversion differences. So any lift detected is often a gross exaggeration.
In fact, experiments with low statistical power may lead you to fall into the trap of the “winner’s curse” in which the statistically significant result looks like a win to be celebrated.
But, in fact, the so-called “win” is actually a massive exaggeration amplified by a small sample.
When teams implement changes based on these unrealistic results, it can dangerously harm performance once the variant is exposed to larger samples of real traffic.
In the end, the result often becomes a curse rather than cause for celebration.
Why AI makes this problem worse
AI-assisted experimentation unintentionally increases the risk of false, exaggerated results.
When tools generate many variations quickly, available traffic gets split across more variants.
More variants don’t compensate for insufficient traffic, they dilute it.
As a result, each version may receive fewer users, increasing randomness and volatility. Apparent wins and losses can become more extreme and even less reliable.
Common causes of underpowered experiments
Underpowered tests often occur when:
- Traffic is limited
- Too many variants are launched at once
- Experiments are stopped early
What to do instead of running unpowered tests
To avoid these test trustworthiness pitfalls:
- Estimate the required sample size before launching
- Limit the number of simultaneous variants run at one time
- Align expectations around the expected effect or conversion increase you suspect you’ll achieve; according to Ron Kohavi, a realistic conversion difference is between 2-5%
If you don’t have enough traffic to run a reliable test, don’t do it! You won’t get reliable results.
And why even bother testing if you can’t trust the results?
Pitfall #3: Overlooking Sample Ratio Mismatch (SRM)
Even if your experiment is perfectly designed and adequately powered, the results can still be unreliable if you overlook Sample Ratio Mismatch (SRM).
SRM occurs when traffic between versions is not split as intended.
In a standard A/B test, traffic should be distributed evenly or according to a predefined ratio.
In SRM, one variant receives noticeably more or less traffic than expected. When this outcome occurs, the assumptions behind your statistical analysis break down, and the results can’t be trusted.
Why SRM is such a serious problem
In fact, even a 0.2% difference in traffic allocation can create SRM and skew results, distort metrics and mislead teams.
SRM is also more common than many teams realize.
Research shows that around 6% of experiments exhibit SRM, even when using a strict detection threshold (p < 0.001).
Common causes of SRM
There are dozens of potential causes of SRM, but most reasons fall into these categories:
- Redirect or targeting issues
- Experimentation code or implementation bugs
- Randomization problems affecting specific segments
- Bot or non-human traffic disproportionately hitting one variant
- Certain acquisition channels consistently assigning users to one variation
How to diagnose SRM
Diagnosing SRM isn’t always straightforward.
One useful starting point is to look for extreme metric values. As Ron Kohavi explains:
“If you see very extreme differences and very small p-values, it may indicate the problem lies in the metric or a specific traffic segment rather than a real treatment effect.”
Why SRM is harder to spot in modern experimentation
AI-assisted and adaptive experimentation can unintentionally increase SRM risk because:
- Traffic may be reallocated mid-experiment
- Certain variants may be favored by optimization algorithms
- AI-generated experiences may behave differently across devices or environments
What to do instead of falling victim to SRM
Without the appropriate guardrails in place, these systems can quietly introduce imbalance before teams notice.
To protect your experiments from SRM, you should:
- Monitor traffic allocation continuously
- Run SRM checks and investigate tests with SRM
- Segment traffic to identify skewed sources
- Use enterprise-grade experimentation platforms, with built-in SRM detectors
As Deborah O’Malley says:
“If your experimentation platform doesn’t have an SRM guardrail, it’s like driving without a seatbelt.”
Kameleoon offers a built-in SRM checker. Through in-app notifications, you’ll get real-time alerts anytime a SRM is suspected or detected. It’s like having a seatbelt light in the car: automated and convenient so you never need to worry about an undetected SRM issue.
SRM does not just reduce confidence, it invalidates conclusions. Catching SRM early is not optional. It's foundational to trustworthy experimentation.
Pitfall #4: Failing to run A/A tests
One of the most effective ways to detect SRM, and uncover hidden issues in your experimentation setup, is through a diagnostic technique known as A/A testing.
In A/A testing, traffic is split evenly between two variations. But all versions are identical; there is no intended difference.
While this set-up sounds somewhat counter-intuitive, it enables you to confirm your experimentation system behaves as expected.
What an A/A test tells you
When your experimentation system is working correctly, the A/A test should show no statistically significant difference between variations. This outcome indicates that:
- Traffic is being randomly and evenly assigned
- Tracking is functioning properly
- Metrics are being recorded consistently
If an A/A test does show a statistically significant difference, it’s a warning sign. It suggests something is wrong beneath the surface.
In that case, the issues are often related to:
- Tracking or instrumentation errors
- Reporting inconsistencies
- Randomization bugs
- Segment-specific issues, like SRM
A note on false positives in A/A testing
Not every statistically significant A/A result means disaster.
By definition, about 5% of A/A tests will show a statistically significant difference purely by chance. This outcome is expected and isn't automatically cause for alarm.
What matters is pattern, not a single result.
Repeated significant differences across A/A tests strongly indicate a systemic issue that needs investigation.
Why teams skip A/A tests and why that decision is risky
A/A tests are sometimes criticized as wasteful because they don’t directly generate conversion lifts. Teams worry they consume traffic and distract from “real” experiments.
That framing is short-sighted.
As Ron Kohavi puts it:
“In testing, there’s a tradeoff between reliable and quick results. You can skip A/A tests to save resources, but you’ll pay for it later by making decisions based on faulty data.”
Skipping A/A tests may feel efficient in the short term, but it increases the risk of rolling out changes based on broken measurement.
What to do instead of skipping A/A testing
A/A testing doesn’t have to slow you down.
Instead, you can perform offline A/A tests by:
- Taking recent experiment data
- Randomly splitting it
- Recomputing metrics
- Measuring how often statistically significant differences appear
These offline checks are inexpensive, don’t reduce testing bandwidth, and are highly effective at surfacing issues.
In addition to using offline A/A testing to validate your measurement system, you can also:
- Run A/A tests periodically as a diagnostic check
- Run A/A/B tests if you have enough traffic to do so
- Monitor patterns rather than react to a single test result
- Treat A/A tests as guardrails, not distractions
A/B testing tells you what to change. A/A testing tells you whether you should trust the data guiding those changes.
Pitfall #5: Disregarding Twyman’s Law
Twyman’s Law says that any figure which looks interesting or different is usually wrong.
In experimentation, if a result looks unusually dramatic or “too good to be true,” treat it as a warning, not a win.
These surprising results are often not trustworthy.
The unexpected outcome is usually related to measurement issues, tracking gaps, or segmentation quirks.
How Twyman’s Law shows up in real experiments
Twyman’s Law can play out in many ways.
For example, if you have a mandatory birthday field on your website form, you might see an unexpectedly high number of users that appear to have the birthday 01/01/01.
While this finding could be viewed as interesting, it would be wise to question whether so many users were actually all born the same day.
The answer is: probably not!
More likely, users were just lazy and ignored the pre-filled date dropdowns, selecting the first item in the list.
As you can gather from this example, with Twyman’s Law, if you see strange data trends, interesting outliers, or massive conversion improvements, be skeptical.
Triple check the results before you celebrate. Otherwise, you may end up falling victim to the winner’s curse.
Other examples of Twyman’s Law may include:
- A “winning” variant that improves a segment you didn’t intend to target, for example, on a browser or specific acquisition channel
- A sudden conversion spike that coincides with a tracking change, pixel outage, or bot burst
- A huge uplift driven by a broken event firing twice, not a better user experience
How AI makes this problem worse
In AI-assisted experimentation, Twyman’s Law may show up even more frequently as:
- A generated variant that accidentally removes friction by breaking a required step; it “wins” because it’s not measuring the same journey
- A variant that increases conversions by changing copy in a way that misleads users or shifts intent, then creates downstream churn
- A “miracle lift” that appears because a small sample
What to do when something looks unusually interesting
When you see a surprising result, especially a big one, pause and verify before you celebrate. You might have invoked Twyman’s Law, in which case, you should:
- Recheck instrumentation and event definitions
- Validate traffic splits and SRM
- Inspect the result by key segments by aspects like device, channel, geo, and browser
- Look for bot patterns, outliers, or repeated users
- Confirm the user journey is functionally the same across variants
If you fail to perform these checks, you risk shipping a “winner” that’s actually a measurement error.
The real-life result: falling straight into the winner’s curse.
Pitfall #6: Failing to adjust testing techniques for data disruption
Many experimentation failures don’t come from obvious statistical mistakes. They come from running yesterday’s testing playbook in today’s data environment.
AI-assisted workflows, tightening browser privacy restrictions, and shifting user behavior have fundamentally changed how data is collected, attributed, and interpreted.
Teams that fail to adapt their experimentation techniques risk drawing conclusions from incomplete or distorted data.
Trustworthy experimentation requires more than good intentions. It requires adapting your methods to a changing landscape.
Not accounting for AI-driven experimentation dynamics
AI and machine learning are increasingly embedded in experimentation platforms, whether teams realize it or not.
Techniques like contextual bandits use machine learning to dynamically allocate traffic toward better-performing experiences while experiments are still running.
Instead of treating experimentation as a fixed A/B comparison, these systems continuously learn and adapt. When used correctly, this approach can:
- Reduce costs
- Improve the user experience during testing
- Surface promising variants faster
AI experimentation evolves, there’s exciting potential in applying machine learning to optimization, but only when teams understand what these systems are doing and what tradeoffs they introduce.
The risk isn’t not adopting AI.
Rather, the risk is adopting it without understanding how it changes statistical assumptions, traffic allocation, and results interpretation.
Not understanding the impact of browser privacy changes
At the same time, data collection itself has become less reliable.
Browser privacy protections, cookie restrictions, and mechanisms like Apple’s Intelligent Tracking Prevention (ITP) increasingly limit client-side tracking. As a result, experiments may silently lose visibility into user behavior, especially across sessions or devices.
When tracking breaks, experiments don’t fail loudly, they fail quietly.
One response to this shift is server-side tagging, which moves data collection away from the browser and into more controlled environments. Server-side approaches are becoming essential for maintaining measurement continuity in privacy-constrained environments because they reduce blind spots.
To ensure continued test trustworthiness, experimenters should select a vendor that has a server-side solution already in place.
Kameleoon is, currently, one of the few vendors that has proactively created a server-side solution. It’s a short snippet that can simply be installed through an HTTP header. The snippet works on all browsers, even if cookies have been removed. The solution is also both GDPR- and CCPA- compliant, and it won’t slow your website.
Teams that fail to ignore changes in data collection and privacy risk trusting results that no longer represent reality.
Failing to account for attribution windows
Another common blind spot is attribution timing.
Most experimentation platforms only count conversions that occur while a test is actively running. For many businesses, that assumption doesn’t match reality.
Sales cycles, lead nurturing, repeat visits, renewals, and delayed purchases all mean that meaningful conversions often happen after exposure to a variant.
When attribution windows are too short:
- Conversion impact is underestimated
- Variants are judged prematurely
- Revenue effects are misrepresented
Small percentage differences compound quickly. A seemingly minor adjustment in attribution timing can materially change conclusions and revenue forecasts.
For example, let’s say you’re an e-commerce retailer and sell shoes for hundreds of dollars. Imagine you run a five-week test using a standard attribution window. During this time, the data shows you achieved a 2.5% conversion rate.
But, by setting your custom attribution window, what you find out is the conversion rate is actually 2.8%.
This difference appears small, but amounts to a 12% change which may equate to thousands of dollars in unaccounted revenue.
The end result is conversion data you can’t totally trust.
What to do instead of falling victim to these issues
To maintain trustworthy experimentation in a disrupted data environment:
- Understand how AI-driven optimization changes traffic allocation and inference
- Adapt measurement approaches to privacy constraints
- Use server-side or hybrid tracking where appropriate
- Align attribution windows with real customer behavior and business cycles
To overcome issues related to incorrect attribution windows, specifically, Kameleoon has created a fully customizable A/B testing custom attribution window. Through the custom attribution window, you can easily select the amount of time you’d like to monitor conversion for every experiment.
This solution reduces the likelihood of faulty, incomplete data sets to help improve test trustworthiness.
Pitfall #7: Neglecting other trustworthiness traps
Even when teams avoid these major statistical pitfalls, experimentation can still quietly go wrong.
That’s because test trustworthiness rarely fails for a single reason. It often erodes through a collection of smaller, overlooked issues that compound over time.
Individually, each issue may seem minor. But taken together, these issues can invalidate results and undermine confidence in the entire experimentation program.
Some of the other most common test trustworthiness traps include:
- “Peeking” and stopping tests early: “peeking” involves checking on and then deciding to end it before the planned sample size is reached. This action dramatically increases false positives and makes results unreliable.
- Misaligned success metrics: problems arise when the test outcomes, measured through Key Performance Indicators (KPIs) or the business’ Overall Evaluation Criterion (OEC) don’t match what’s actually being tested. When metrics and hypotheses aren’t aligned, conclusions become misleading.
- Chasing small data discrepancies: it’s common for different tools to report slightly different numbers. Getting stuck reconciling every discrepancy instead of choosing a clear source of truth and focusing on directional patterns wastes time and distracts from real insights.
- Incorrect confidence interval calculations: confidence intervals are meant to communicate uncertainty. When they’re computed incorrectly, or ignored entirely, teams gain a false sense of precision and overconfidence in results.
- Ignoring bot traffic: Bots make up a meaningful portion of web traffic and can disproportionately affect certain variants. If not filtered or accounted for, bots can distort metrics, trigger SRM, and create phantom “wins.”
- Overlooking instrumentation issues and outliers: broken event tracking, double-firing tags, missing data, or extreme outliers can all skew results. These issues often surface only when teams actively audit their instrumentation rather than assuming it works.
Why these pitfalls are so damaging
These issues don’t just affect individual experiments. They chip away at credibility.
When stakeholders see results reversed, rolled back, or contradicted over time, trust in experimentation erodes.
Testing teams then face skepticism, reduced buy-in, and pressure to justify every test, making it harder to successfully scale experimentation.
What to do instead of falling into test trustworthiness traps
To protect test trustworthiness:
- Commit to predefined run times and rules for when to stop tests
- Clearly define and align your success metrics
- Establish a single source of truth for reporting
- Actively monitor for bots, outliers, and instrumentation errors
- Treat data validation as an ongoing practice, not a one-time setup
In an increasingly automated, AI environment, it’s also important to:
- Treat automation as acceleration, not a replacement for human-validated decisions
- Use human judgement to make major decisions
- Establish AI as a way to surface options, not dictate outcomes
Experimentation succeeds not because teams avoid one mistake but rather because they consistently guard against many small ones.
A practical checklist for modern experimentation teams
Here’s a helpful checklist to help you ensure test trustworthiness every step of the way:
Before Launch
- Define a clear hypothesis and success metric(s)
- Estimate the required sample size and test duration
- Identify risks like seasonality or traffic shifts
During the Experiment
- Monitor traffic allocation and check for SRM
- Avoid peeking or stopping the test early
- Track variance and anomalies in AI‑generated outputs
After the Experiment
- Interpret results using p-values and statistical significance
- Validate learnings across segments
- Document outcomes and limitations
Final thoughts to avoid test trustworthiness traps
With AI, experimentation has never been more accessible, but that accessibility doesn’t remove responsibility.
Whether you’re testing a single headline or deploying AI‑generated experiences at scale, statistical rigor and data accuracy remain the foundation of trustworthy decision‑making.
By actively addressing these pitfalls, you’re more likely to run accurate, reliable experiments.
With data you can trust, you can confidently make decisions that increase your revenue and build your testing program’s reputation and credibility.
For more on how to achieve trustworthy online experiments, learn how to overcome the three biggest challenges with data accuracy.
To learn more about how to run trustworthy tests through Kameleoon, click here to request a demo.